
Field guide
Lot acceptance
Acceptance Sampling: What a Zero-Defect Sample Really Says
A clean sample can come from a defective lot. Check the odds.

Vrolen blog
Practical field guides for teams connecting operational data, diagnosing system behavior, and choosing what to improve next.
Lot acceptance
A clean sample can come from a defective lot. Check the odds.
Work design
Draw the overlap before adding operator and machine times.
Manufacturing data
Follow one suspect lot without counting its history twice.
Quality risk
A reversed connector, a keyed fixture and an action that stays open until the test is done. Make the risk review useful after the meeting.
Pull replenishment
Eighteen cards can authorize 360 units. Before adding another card, find out which part of the replenishment loop needs it.
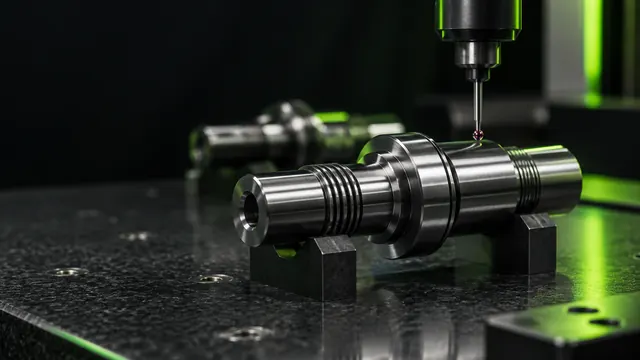
Process capability
The spread can stay the same while Cpk falls from 1.33 to 0.80. A shifted process needs a different response from a noisy one.
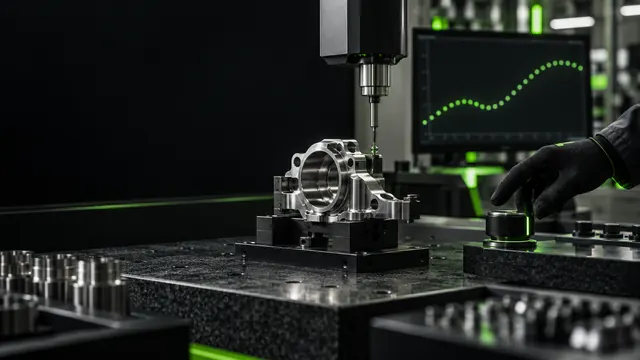
Statistical process control
A batch with more rejects deserves context before an adjustment. A control chart gives the investigation a stated rule.
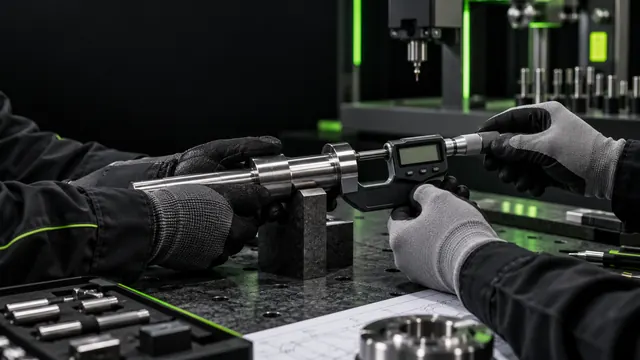
Measurement system analysis
A measurement can look precise on screen and still change with the operator. Check the measuring process before judging the production process.
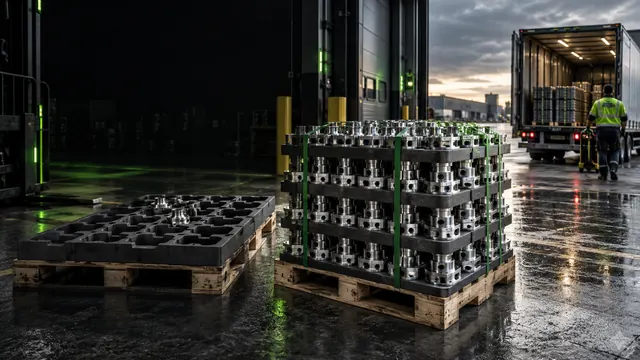
Delivery reliability
The fictional ten-order example starts at 70%. Change a receipt check to see why the joint count matters. Set eligibility and receipt checks from your agreed reporting rules before entering real records.
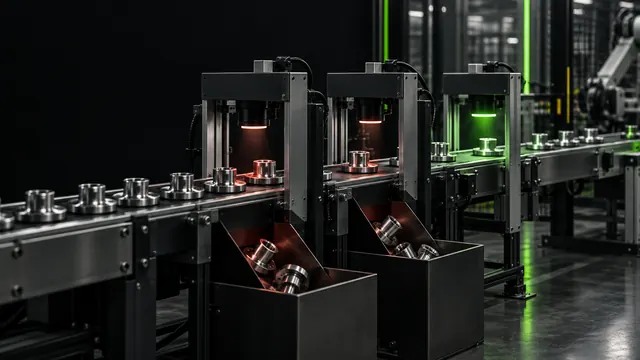
Multi-stage quality
Three stages at 90% first-pass yield leave 72.9% of the starting units passing every stage without rework.
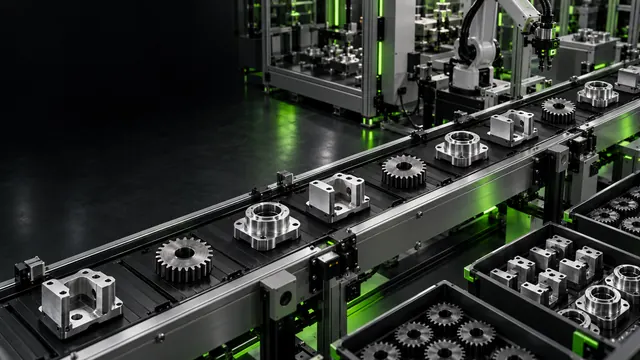
Production leveling
A repeating AABC sequence can match a 2:1:1 product mix. It only works if the line can actually replenish that mix at the planned interval.
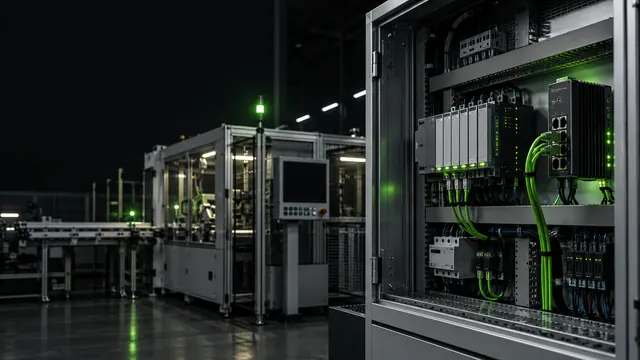
Manufacturing data integration
A delivered message can still contain the wrong unit, an old value or a duplicate event. Reliable analytics needs the meaning as well as the connection.
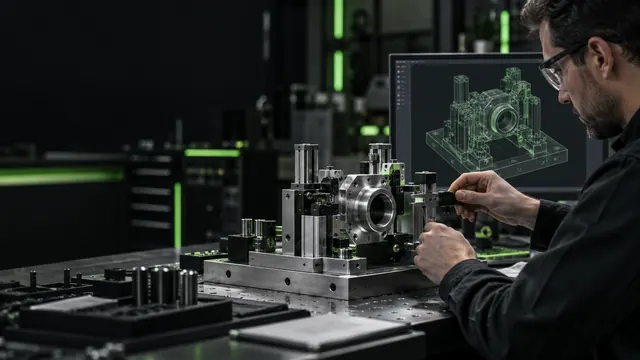
Simulation credibility
A model can match weekly output and still miss the daily pattern. Decide what evidence would make its recommendation credible before tuning it.
Manufacturing energy performance
Electricity can fall 5% while energy per accepted unit rises nearly 7%. The denominator changes the conclusion.
Downtime cost
One hour stopped can cost €350, €530 or €1,150 in this worked example. The difference is what happens to the missing production.
WIP and lead time
240 units in progress at 80 units per working hour imply three working hours of average lead time. Here is what that calculation does, and does not, tell you.
First-pass yield
970 of 1,000 parts can eventually pass while only 900 pass first time. A clear unit ledger shows the work hidden between those two results.
OEE formula
Calculate OEE from Availability × Performance × Quality with a worked example, then map the score to the six big losses.
Takt vs cycle vs lead time
Formulas, one worked production example, and the mistakes that lead to bad capacity decisions.
Agentic AI
What an AI agent is in a plant, three good first use cases, an autonomy ladder and the guardrails that keep it bounded.
Downtime Pareto analysis
Once you have downtime events, how do you decide which one to investigate? Two rankings, a reason hierarchy and one honest caveat.
OEE vs throughput
Seven reasons a better OEE score can leave shipments, lead time and delivery unchanged.
A3 problem solving
Seven sections, one worked example and an original worksheet, plus why filling the boxes is not the method.

Manufacturing KPI tree
A four-level hierarchy that connects business outcomes to the drivers you can actually act on.
Line balancing
A worked example of takt, work content and operator loads, and why the arithmetic minimum is often not achievable.

AI root cause analysis
What AI does well in a root-cause investigation, the four ways it misleads, and how a candidate becomes a verified cause.
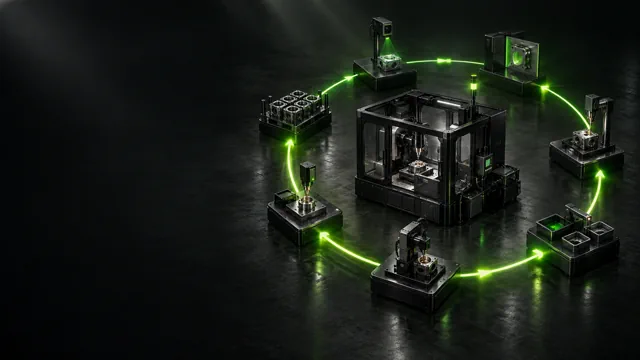
AI for continuous improvement
A seven-step loop that shows where AI speeds up continuous improvement and what people must still own.

OEE vs TEEP vs utilization
Most pages explain the formulas. This one explains which management decision each metric supports.

Dynamic bottlenecks
Averages create the illusion of a permanent constraint. Here is how the limiting station moves and how to see it.
MTBF vs MTTR vs OEE
Four failures, two time records and a calculation you can check. Learn why the hours behind the average matter as much as the number.

Digital twin vs simulation vs process mining
A comparison by question and evidence, and a rule for choosing the smallest model that can change the decision.
Manufacturing analytics software
Sixteen criteria in four groups, six vendor categories and when each is appropriate. No invented ranking of named vendors.

MES vs OEE vs analytics
A need-to-layer matrix and a four-layer model: record, execution, analysis and improvement.
RCA software
Five categories of RCA software, the capabilities that matter and how to spot a tool that skips the proof.

Continuous improvement in manufacturing
A practical system for finding, testing, verifying, and sustaining manufacturing improvements with evidence.

Lean manufacturing
Understand lean principles, flow, pull, standard work, problem solving, and the conditions required for lasting results.
Operational excellence in manufacturing
Align purpose, people, processes, technology, and measures so better results survive beyond individual projects.
Continuous improvement software
Evaluate CI software for evidence capture, prioritization, experiments, governance, integrations, security, and adoption.

Manufacturing software guide
Use ISA-95 boundaries and real operating decisions to design a manufacturing software architecture without duplicate systems.
The eight wastes of lean manufacturing
Spot defects, waiting, extra movement and the other wastes on a real process walk. Record what you see before deciding what to change.
Lean manufacturing vs Six Sigma
Compare goals, methods, data needs, strengths, and failure modes before selecting an improvement approach.

Continuous improvement project portfolio
Select, sequence, stop, and verify Kaizen and capital projects using system impact, evidence, capacity, risk, and learning.
Operational excellence metrics
Design a connected metric system spanning safety, quality, delivery, flow, cost, people, resilience, and verified improvement.
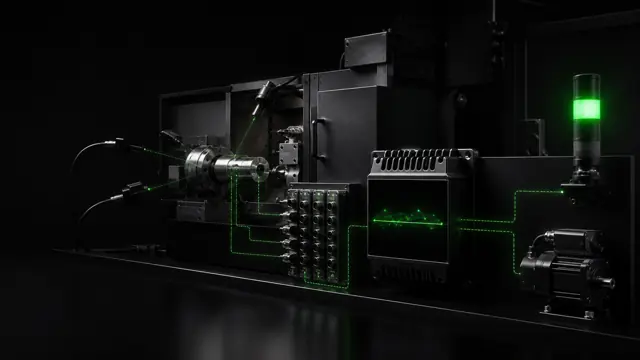
Real-time production monitoring
Connect machines, sensors, orders, quality, and people while controlling latency, context, alarms, security, and response.

Value-stream mapping
Map the flow, add assumptions, and test changes before rollout.

Root-cause analysis
Follow a recurring packaging fault from the first observation to a testable cause, then use the worksheet for your own investigation.

OEE loss analysis
Connect availability, performance, and quality loss to total flow.
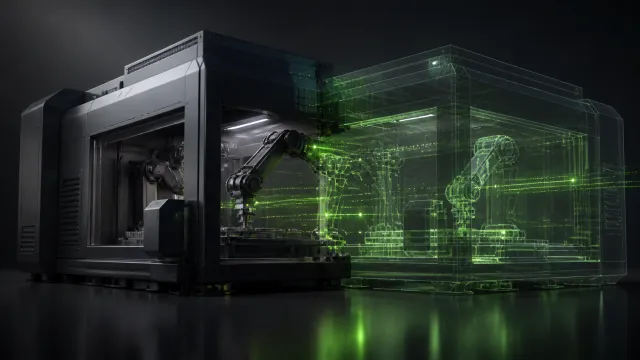
Digital twin in manufacturing
Connect live operating data to a validated model, test scenarios, and turn results into controlled improvements.
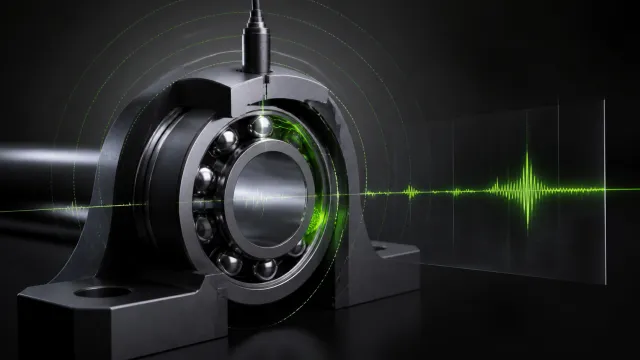
Predictive maintenance
Use sensors, maintenance history, AI, and simulation to detect degradation and choose the right intervention window.
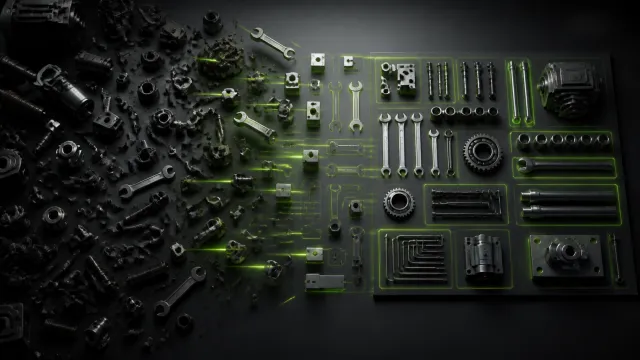
5S methodology
Use sort, set in order, shine, standardize, and sustain to expose abnormal conditions and protect flow.

Kaizen event
Frame the problem, observe the real process, test countermeasures, and sustain the result after the workshop.

Lean Six Sigma
Separate flow and waste problems from variation and defect problems, then use evidence to select the right method.
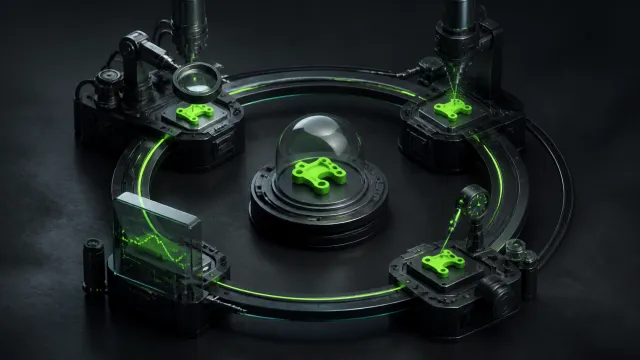
PDCA cycle
Define a prediction, test a controlled change, study the result, and standardize only what the evidence supports.
SMED changeover reduction
Separate internal and external setup, simplify adjustments, and verify quality, safety, and total-system flow.

Theory of Constraints
Identify, exploit, subordinate, elevate, and repeat while measuring throughput, inventory, and operating impact.

Manufacturing bottleneck analysis
Combine cycle time, queues, blocking, starvation, product mix, and simulation instead of relying on utilization alone.

Process mining in manufacturing
Reconstruct process variants from timestamps, compare conformance, and connect discovered delays to physical operations.
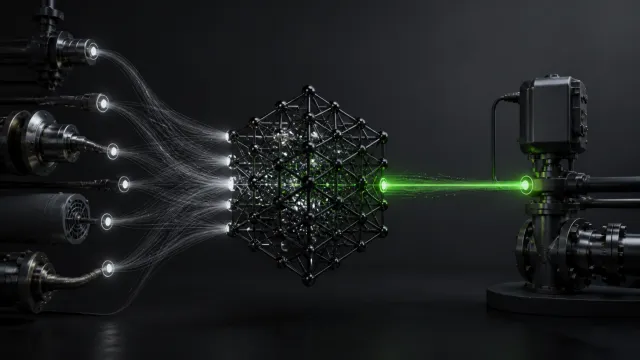
Industrial AI in manufacturing
Connect production data, domain knowledge, machine learning, and simulation with clear confidence and human control.
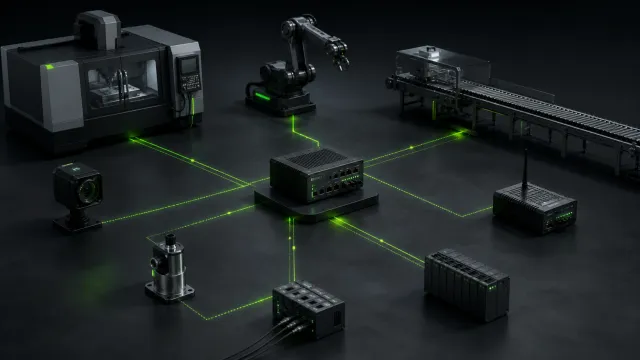
Industrial IoT and smart manufacturing
Design an IIoT path from sensors and PLCs to interoperable context, secure analytics, and operational action.
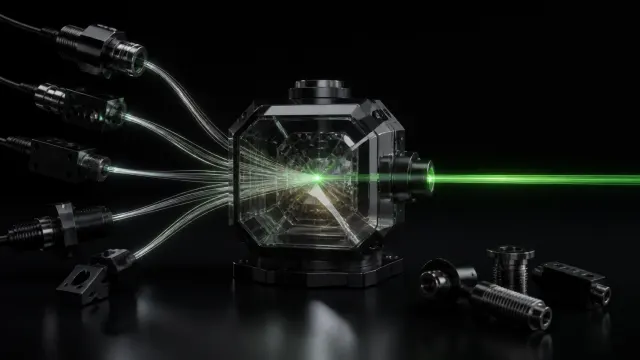
Manufacturing data analytics
Build trustworthy manufacturing analytics from PLC, sensor, MES, ERP, quality, maintenance, and manual data, then connect every insight to an operating decision.

Production downtime tracking
Record what stopped, when it restarted and what is actually known. Then check how a reporting threshold changes the loss categories.

Production scheduling optimization
Combine orders, constraints, changeovers, labor, material, downtime, and uncertainty to test schedules before releasing them to the floor.
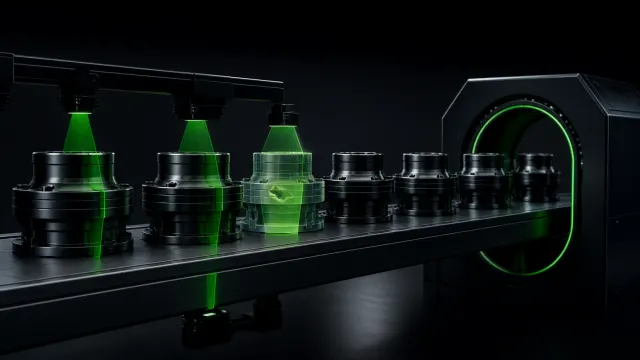
Predictive quality in manufacturing
Connect process conditions, product context, inspection results, and machine learning to intervene before defects become scrap or customer escapes.
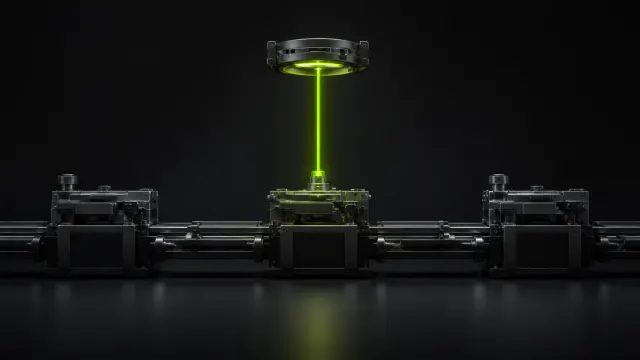
Andon system in manufacturing
Use clear abnormality signals, owned escalation, response-time measures, and root-cause follow-up so alerts improve flow instead of becoming background noise.
Private pilot