
An A3 is a one-page problem-solving report, named after the paper size it is drawn on. It walks one problem through background, current condition, target, causal analysis, countermeasures, implementation and follow-up. The page is a thinking tool: the value is in observing the real process, testing causes and checking the result. A completed template with untested causes is not an A3. It is a form.
Seven sections explained with the question each must answer
A worked example on a recurring label misalignment
An original worksheet you can copy and edit
The original seven-panel layout as a printable A3 page with a check under each panel.
MarkdownA3 problem-solving worksheet (editable)An original Vrolen layout with a prompt and a quality check for each of the seven sections.
What an A3 is, and what it is not
The Lean Enterprise Institute describes the A3 report as a way to tell the story of a problem on a single sheet of large paper, and stresses that it is much more than a sheet with facts and figures: it is a management process learned through dialogue between a leader and the person solving the problem. The format forces concision, and the concision forces clarity about what you know, what you assume and what you still have to test.
It is the written form of a PDCA cycle. The page is not the method. The method is going to the process, observing, testing and checking. This article gives an original layout with the same underlying logic, not a copy of anyone’s template.
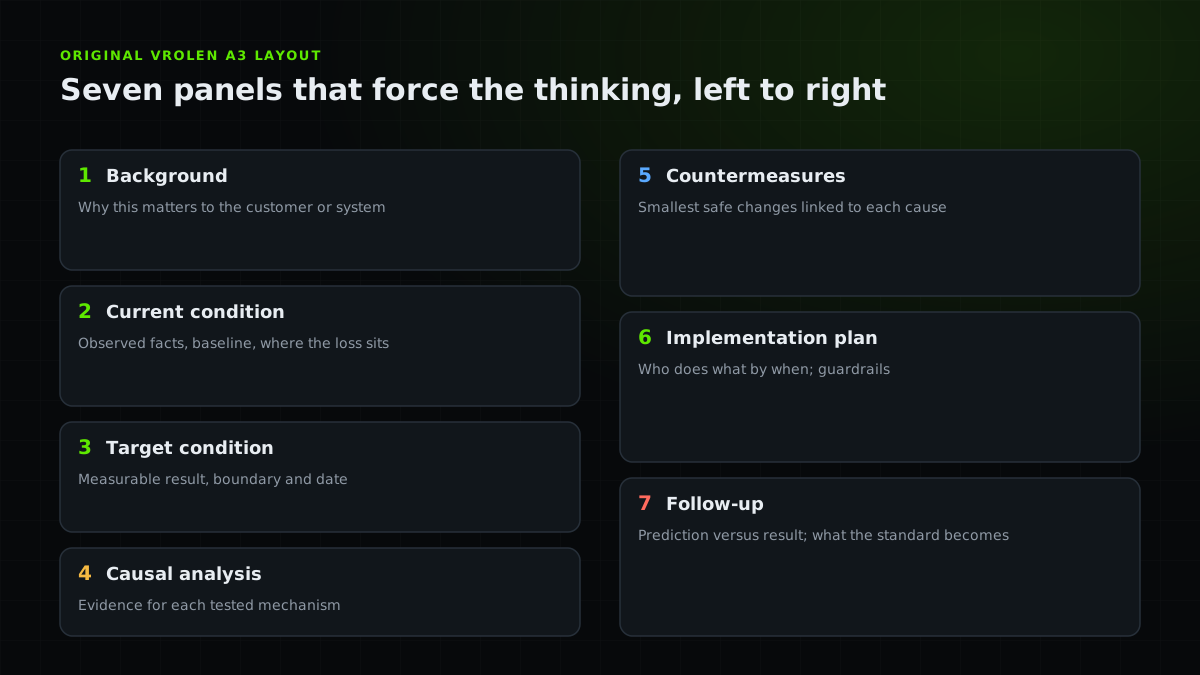
The seven sections
Each section answers one question, and each has a check that stops the page from becoming decoration.
| Section | Question it answers | Check |
|---|---|---|
| 1. Background | Why does this matter to the customer or system? | A reader outside the team can see the stake |
| 2. Current condition | What is happening now, with facts? | Baseline data and observation, not opinion |
| 3. Target condition | What result do we want, by when? | Measurable, bounded and dated |
| 4. Causal analysis | Why is it happening? | Every cause is tested, not asserted |
| 5. Countermeasures | What will we change? | Each change links to a tested cause |
| 6. Implementation plan | Who does what by when? | Owners, dates and guardrails named |
| 7. Follow-up | Did it work, and what did we learn? | Prediction compared with result |
Worked example: a recurring label misalignment
Consider a filling line that stops several times a week when labels arrive misaligned and the vision system rejects the bottle. The quality team asks for an A3. The numbers below are illustrative.
The team fills the boxes in order, and the useful work happens in sections 2 and 4.
- Background
Label stops cost about 4 hours a week on a constraint line, and the rejects are reworked by hand.
- Current condition
Observed 31 stops over two weeks. 24 followed a bottle-size change. Labels drift by up to 3 mm after the first 30 bottles.
- Target condition
Cut label stops by 80% within six weeks, with no rise in changeover time.
- Causal analysis
Tested three causes. Roll tension and applicator height showed no link. The label sensor’s position after a size change did: stops fell to zero when it was set to a marked position.
- Countermeasures
Mark the sensor position per bottle size and add it to the changeover standard.
- Implementation
The operator lead updates the standard and trains all shifts by the end of week two.
- Follow-up
Predicted 80% fewer stops. Observed 87% over six weeks, changeover time unchanged.
Why filling boxes is not the method
A completed template is easy to produce and easy to get wrong. The signs are familiar: the current condition contains opinions, the causes are listed rather than tested, the countermeasures are the ones the team already wanted, and the follow-up is empty.
Fix it by tying each section to evidence. Use a downtime Pareto to choose the problem, root-cause analysis to test causes, and a defined verification window to check the result.
Verify before you close
Set the verification window when you write the target, not after the fix. A window that covers different shifts, products and conditions guards against a result that only holds on one good week. If the prediction and the result disagree, that is learning, and it belongs on the page.
When the A3 is done, feed the finding back into standard work, and into the improvement backlog of a Kaizen event or your wider continuous improvement system.
Practical checklist
- Choose a problem small enough to finish and large enough to matter.
- Write the current condition from observation and data, not opinion.
- State a measurable target with a boundary and a date.
- Test each candidate cause before naming it a cause.
- Link every countermeasure to a tested cause.
- Name an owner and date for every action.
- Set the verification window when you write the target.
- Compare the prediction with the result and record what you learned.
FAQ
Questions before you join
Sources and further reading
Authoritative references used to research and verify this guide.