
OEE can rise without throughput rising for seven reasons: you improved a non-constraint, the constraint moved, the extra output became inventory, the OEE definition changed, the product mix shifted, quality problems moved downstream, or demand never needed the recovered capacity. Check the constraint first, then the metric definition, then downstream flow. OEE measures loss at a resource. Throughput is decided by the system.
Seven causes with a check for each
A simple example where OEE rises and output does not
The metrics to pair with OEE so it cannot mislead
An OEE increase is not automatically a business improvement
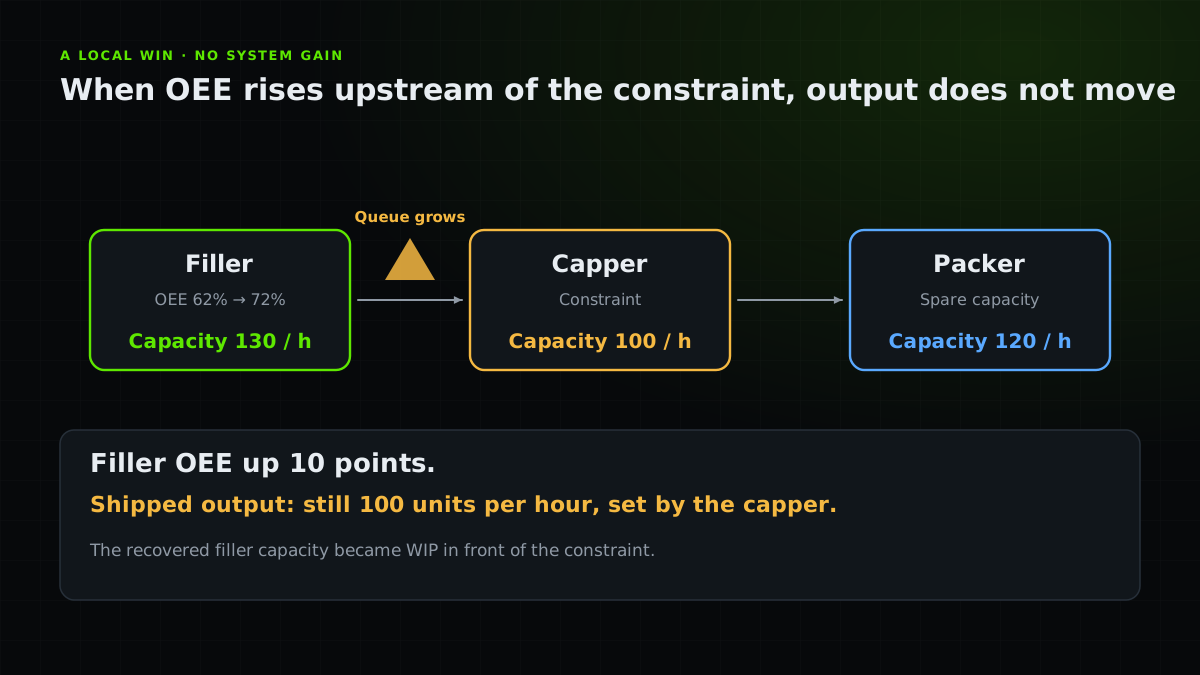
If OEE rises from 62% to 72% but shipped output, lead time or on-time delivery does not move, the improvement was real at the resource and absent in the system. The picture below shows the most common version.
Vrolen’s editorial rule for this kind of problem is simple: never optimize a metric until you can explain how movement in that metric should propagate through the system.
Seven causes, and how to check each
Work through the list in order. The first three are about where the improvement landed, the next three about how the numbers were produced, and the last about whether the capacity was needed.
| # | Cause | How to check |
|---|---|---|
| 1 | You improved a non-constraint | Compare the resource’s capacity with the constraint’s. Recovering 100 minutes at a resource with spare capacity creates local capacity only. |
| 2 | The constraint moved | Recheck the bottleneck after every improvement. See dynamic bottlenecks. |
| 3 | Output became inventory | Look for WIP growing in front of the next operation. |
| 4 | The OEE boundary changed | Audit planned time, ideal cycle time, stop coding and product segmentation before and after. |
| 5 | Mix changed | Recalculate OEE per product. Higher-OEE products may dominate the period while total output value stays flat. |
| 6 | Quality moved downstream | Check downstream rework, inspection and customer returns for the same period. |
| 7 | Demand did not need the capacity | Compare recovered capacity with demand at the constraint. |
Cause 4 deserves extra suspicion: the boundary changed
Teams can improve a score without improving the process by excluding planned time, loosening the ideal cycle time, recoding stops or segmenting products differently. Sometimes this is deliberate. More often it is a well-meant cleanup of definitions.
Audit the metric definition before celebrating. The OEE formula guide lists the definitions to lock down.
When the improvement is still worth having
If the plant already has enough capacity, the economic benefit of a higher OEE may be fewer shifts, resilience, more maintenance time or shorter lead time, not more throughput. Those are valid reasons, but they should be stated, because otherwise a team reports a throughput gain that never arrived.
Use the theory of constraints to decide where recovered time turns into shipments and where it does not.
What to measure alongside OEE
Pair OEE with measures that show whether the system moved. A resource-level score should never be read without them.
- Constraint throughput
Good units per hour at the resource that limits output.
- Lead time and WIP
Are queues shrinking or growing?
- On-time in-full
Did the customer see a change?
- First-pass yield
Is quality holding across the process?
- Demand and schedule attainment
Was the recovered capacity needed and used?
Practical checklist
- Identify the constraint before choosing an OEE project.
- Recheck the constraint after every significant improvement.
- Watch WIP in front of the next operation.
- Freeze the OEE definition before measuring improvement.
- Recalculate per product when the mix changes.
- Check downstream rework and returns for the same period.
- Compare recovered capacity with demand.
- Report constraint throughput, lead time and on-time delivery beside OEE.
FAQ
Questions before you join
Sources and further reading
Authoritative references used to research and verify this guide.