
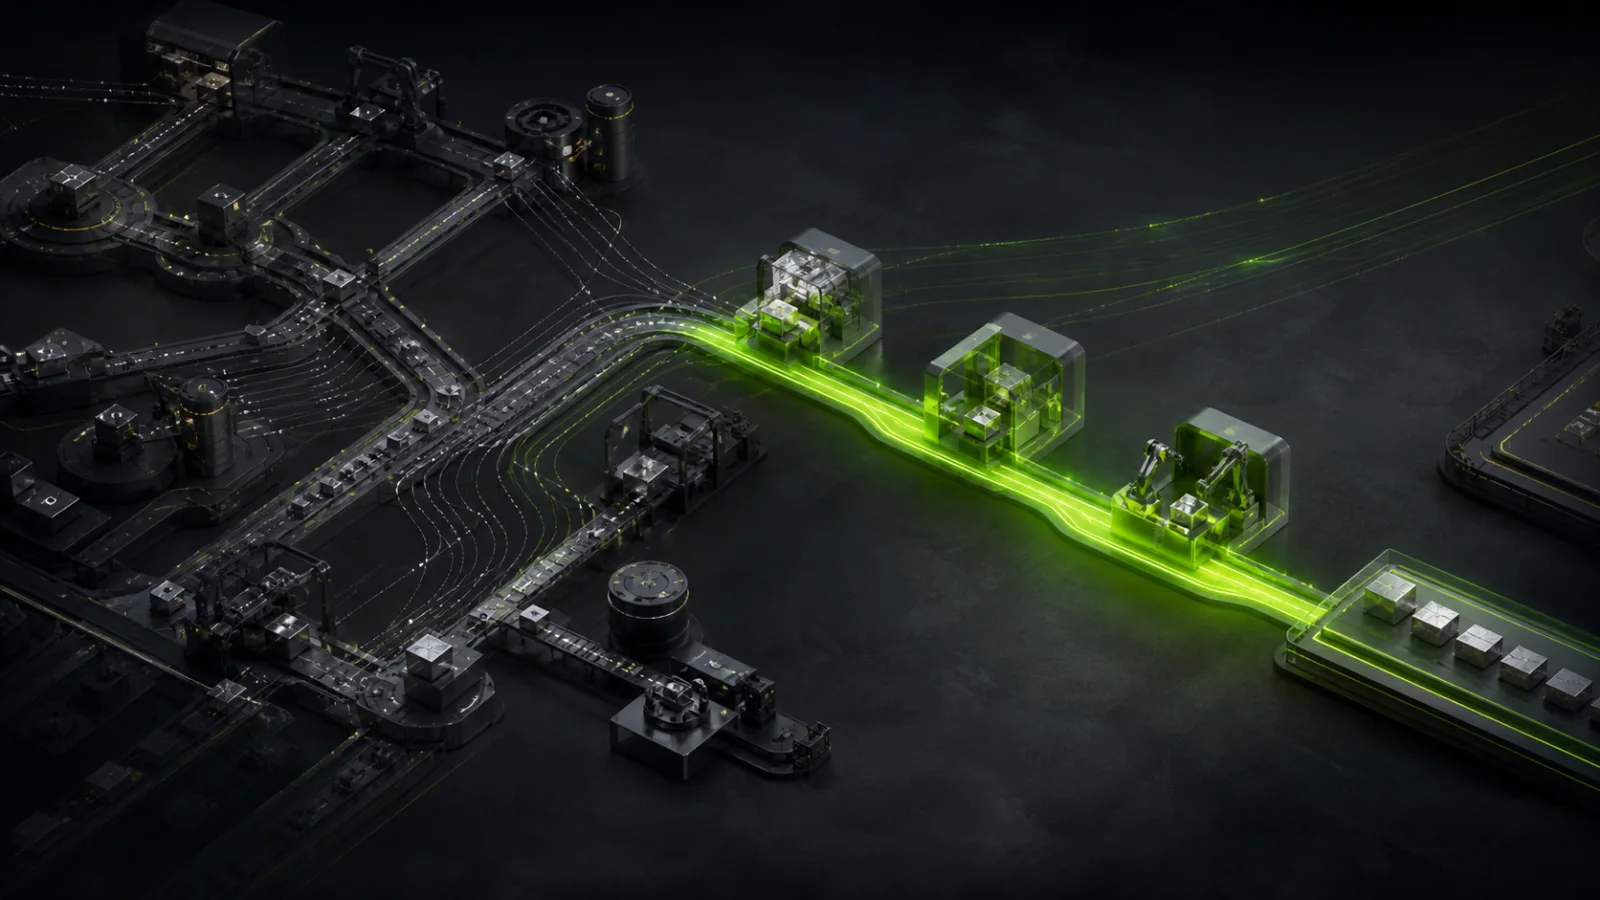
Value-stream mapping (VSM) is a team method for seeing the material and information flow required to deliver a product or service. A useful VSM connects a measured current state to a designed future state and an implementation plan. Simulation extends the map by testing whether the proposed future state still works when demand, downtime, queues, staffing, and cycle times vary.
Visual current-state model
Comparable future-state scenarios
Constraint and sensitivity analysis
What value-stream mapping should answer
A value-stream map should make the end-to-end flow understandable: what the customer needs, how work is triggered, where material waits, which steps transform it, and how long the complete journey takes. It is not a detailed layout drawing or a list of isolated process improvements.
The Lean Enterprise Institute describes current-state mapping as the starting point. The team observes the actual flow, then designs a future state and a practical plan for moving toward it. That sequence matters: a future-state diagram without a verified baseline is only a proposal.
- Where does customer demand enter the system?
- How do material and information move from door to door?
- Where do waiting, rework, batching, or handoffs extend lead time?
- Which process currently sets the pace for the whole value stream?
Build a current state from operating facts
Walk the process and record a small, consistent set of facts. For each step, capture cycle time, changeover time, uptime or downtime, available time, staffing, yield, queue or inventory, and the rule that releases work. Add customer demand and shipment cadence so the map has a real operating target.
Separate observed values from estimates. A range such as 42–55 seconds is often more honest than an average of 48 seconds. Record the source and date of each input; otherwise the map becomes difficult to challenge or update.
- Demand, available production time, and takt time
- Cycle time, changeover, uptime, yield, and staffing by process
- WIP, queue limits, buffers, batch sizes, and transport delays
- Production-control rules, schedules, signals, and information latency
Why a static map can approve the wrong future state
A conventional VSM is excellent for alignment, but it usually shows representative values rather than the sequence of events that creates queues and starvation. Two future states can look equally lean on paper while behaving very differently under failures, product mix, shift breaks, or variable arrivals.
A simulation does not replace the workshop. It turns selected assumptions into a repeatable experiment. The team can ask whether a smaller buffer increases blocking, whether one operator can serve two processes during peak demand, or whether faster equipment simply moves the constraint downstream.
Test a future state without hiding assumptions
First validate that the baseline model reproduces the current operation closely enough for the decision at hand. Then change one improvement concept at a time before testing combinations. Compare the same demand window and random conditions so results are not distorted by different input scenarios.
Report a range, not a heroic point estimate. Throughput, lead time, WIP, service level, OEE at the constraint, and resource utilization are usually more decision-useful together than any single metric. Sensitivity analysis reveals which uncertain input could reverse the recommendation.
- Frame the decision
Name the customer outcome, boundary, time horizon, and decision owner.
- Validate the baseline
Compare modeled throughput, queues, downtime, and lead time with observed data.
- Run controlled scenarios
Change pull rules, buffers, staffing, sequence, reliability, or capacity with assumptions visible.
- Stress the result
Vary demand, mix, failures, and cycle-time distributions.
- Choose the experiment
Select the smallest safe change that can confirm or reject the model’s recommendation.
Turn the map into a living improvement loop
A map creates value when it changes decisions. Assign every future-state change an owner, an expected outcome, a review date, and a measurement plan. After implementation, compare actual behavior with the prediction and update the model.
Connected data from PLCs, sensors, MES, ERP, or simple CSV logs can keep cycle times, downtime patterns, and demand assumptions current. AI and machine learning can help detect shifts and candidate relationships, while simulation tests system consequences. People still approve the experiment and verify the result.
A related example from Abolfazl
Compare active work with waiting in a separate order-flow example.
In English, on founder Abolfazl’s personal blog. This is related reading, not an independent technical source.
Practical checklist
- Define one product family and a clear door-to-door boundary.
- Observe the actual flow; do not map the official procedure alone.
- Record material flow and information flow together.
- Label estimates, sources, timestamps, and uncertainty.
- Validate the current-state model before comparing future states.
- Measure customer outcomes and system flow, not only local utilization.
- Convert the selected future state into owned experiments and review dates.
FAQ
FAQ
Sources and further reading
Authoritative references used to research and verify this guide.