
A dynamic bottleneck is a constraint that moves between stations as product mix, changeovers, downtime, staffing, material and quality holds change. Averages hide this, because they blend the periods when each station was the limit. To find the current constraint, look at time-based evidence: which station is busiest without being starved or blocked, where queues build, and how that changes by hour, product and shift.
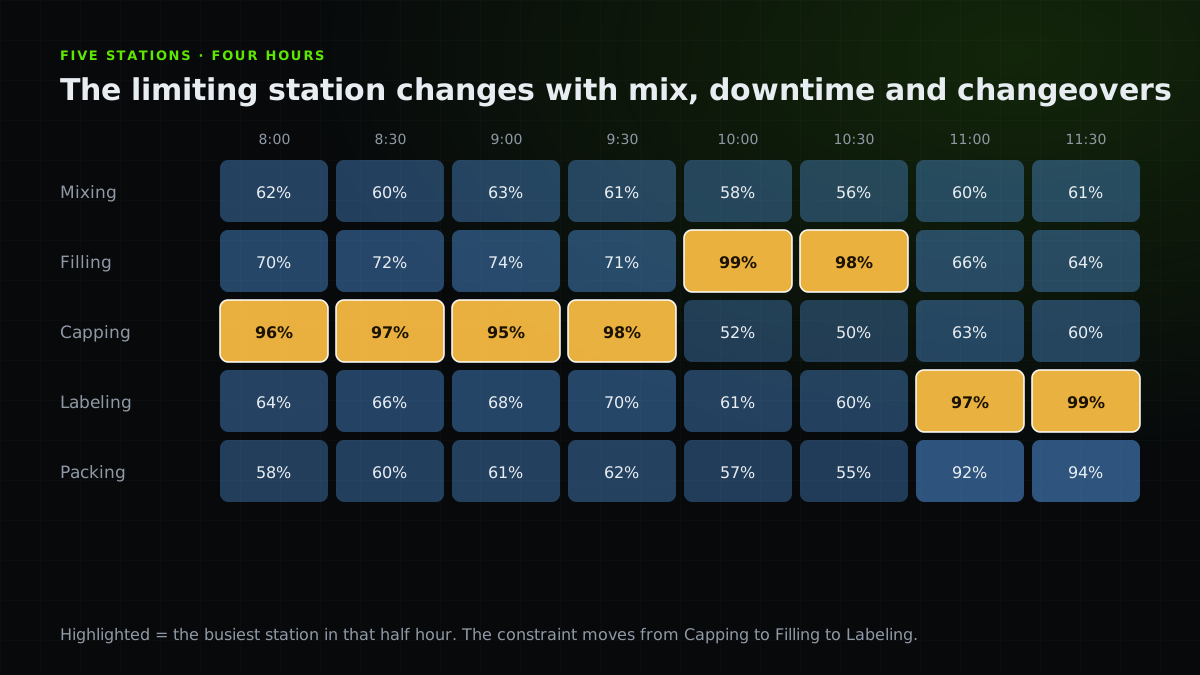
A four-hour example where the limiting station changes twice
A list of what makes a constraint move
A method that uses event data, not averages
Averages create the illusion of a permanent constraint
The classic capacity table lists each station’s average rate and names the slowest one the bottleneck. It is a useful first guess and a poor description of a real plant, because the line does not run at averages. It runs one product, one changeover, one breakdown at a time.
The heat map shows five stations over four hours. The busiest station in each half hour is highlighted, and it is not the same one throughout.
What makes a constraint move
Any factor that changes a station’s effective capacity can move the constraint. The common ones are the ones a static table cannot represent.
| Factor | How it moves the constraint |
|---|---|
| Product mix | Different products take different times at each station. |
| Changeovers | A station that is fast in steady running may be slow during a changeover. |
| Downtime | A failure at one station shifts load and starves the stations after it. |
| Staffing | A manned station can become the limit when a person is absent. |
| Material availability | A station starved of input stops being the limit until material returns. |
| Campaign sequence | The order of products changes when each station’s peak load arrives. |
| Quality holds | A hold downstream can block a station that was not the limit before. |
How to detect the current constraint
Use event data by time window instead of one plant-wide average. The active constraint is not merely the busiest station. It is the one that is working, and not waiting for material or for downstream space, while queues build in front of it.
- Slice by time
Calculate station load in short windows such as 30 minutes or one order.
- Exclude idle causes
Separate time spent working from time starved or blocked.
- Read the queues
A growing queue in front of a station and an empty one after it is the classic sign.
- Segment
Repeat by product, shift and changeover state to see when the answer changes.
- Recheck
After every change, repeat. See bottleneck analysis.
Why this changes what you improve and how you schedule
If the constraint moves, improvement projects aimed at a single machine pay off only part of the time. The better targets are often shared: changeover methods, material flow, response to stops and schedule rules.
It also changes scheduling. A schedule that protects one station can starve another that becomes the limit under the next product. Production scheduling optimization covers how to test sequences against several constraint states, and the theory of constraints explains the exploit-and-subordinate logic behind it.
When a static capacity spreadsheet is enough, and when it is not
A capacity table is fine for a stable line with one product and a large gap between the slowest station and the rest. It fails when the mix is varied, changeovers are frequent or the gaps are small. In those cases, event-level data and scenario testing are needed to see the movement. A digital twin or simulation is one way to test what happens when the constraint moves, and manufacturing data analytics covers the data you need underneath.
Practical checklist
- Do not name a bottleneck from average capacity alone.
- Calculate load by short time window, product and shift.
- Separate working time from starved and blocked time.
- Look at queues before and after each candidate station.
- Check whether the answer changes with product mix and changeovers.
- Prefer improvements that help whichever station is the limit.
- Recheck the constraint after every change.
- Test schedules against more than one constraint state.
FAQ
Questions before you join
Sources and further reading
Authoritative references used to research and verify this guide.