
Rolled throughput yield is the product of first-pass yields across a defined sequence of process steps. For a serial cohort with consistent routing, it describes the share passing every step without rework. Keep unit identities, stage entrants and first-pass outcomes consistent. Do not multiply final yields that include recovered units, average the stage percentages, or combine unrelated periods. Parallel routes and re-entry loops need an explicit route model rather than one convenient product.
Calculate multi-step quality from a traceable unit cohort.
Separate first-pass success from eventual recovery.
Find the stage that creates the largest current loss.
Define the route a unit must complete
A final inspection can accept a repaired part while hiding the work required to get it there. RTY asks a stricter question: which starting units passed the defined sequence the first time, at every step?
ASQ discusses RTY as a multi-process performance measure. Here the example uses unit-based first-pass outcomes through a serial route. It does not use a defect-per-opportunity or Poisson model.
Use the first-pass yield guide for one stage and rework accounting. This companion follows quality across several steps without losing the starting cohort.
Use conditional stage yields, not unrelated averages
For each step, divide first-pass good units by the units entering that step in the defined first-pass route. Multiply those conditional yields. Keep the same cohort and do not reintroduce recovered units into its first-pass survivors.
For such a nested serial cohort, the ratios cancel to final first-pass survivors divided by original entrants. That relationship does not require a claim that failures at different stages are statistically independent. Multiplying unrelated historical rates to predict a new route is a different modelling task.
Use fractions, then multiply by 100 for percent. For a consistent nested cohort: RTY = final first-pass survivors / original entrants.
Follow 1,000 units through three gates
Illustrative example: 1,000 unique units enter stage one. Its first-pass survivors are 900. Those 900 enter stage two and 810 pass. Those 810 enter stage three and 729 pass. Units failing a gate are removed from this first-pass path, whether later scrapped or reworked elsewhere.
Each conditional stage yield is 90%. RTY is 0.9 × 0.9 × 0.9 = 0.729, or 72.9%. The same answer comes from 729 / 1,000. Averaging the three 90% figures would report 90% and miss the route-level question.
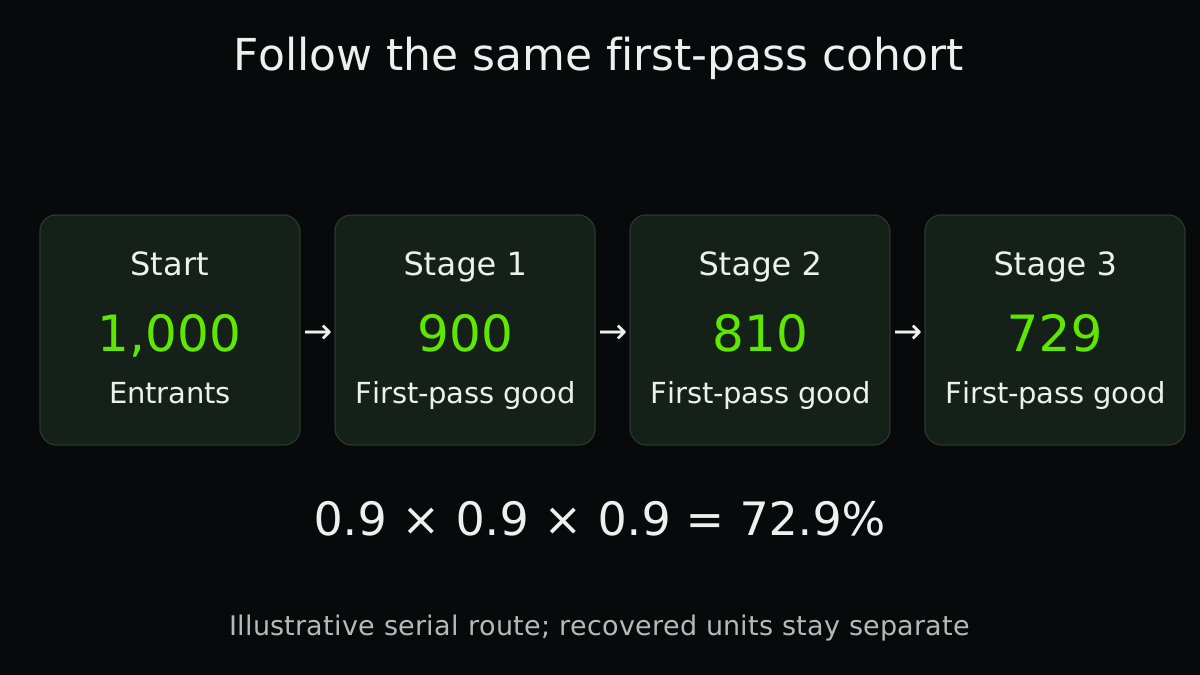
| Stage | First-pass entrants | First-pass good | Conditional FPY |
|---|---|---|---|
| 1 | 1,000 | 900 | 90% |
| 2 | 900 | 810 | 90% |
| 3 | 810 | 729 | 90% |
Rank losses with counts as well as percentages
The example loses 100 first-pass units at stage one, 90 at stage two and 81 at stage three. Equal stage percentages do not mean equal unit losses because the populations differ.
If one stage rises from 90% to 95% while the other two remain 90%, the modelled RTY is 0.95 × 0.9 × 0.9 = 76.95%. That is an arithmetic scenario, not a promised improvement. Real changes can alter routing, detection or downstream failure.
Use consequence, cost and failure causes alongside the count. Fixing a harmless detection issue and preventing a serious customer defect do not have the same value.
- Choose a completed starting cohort
Keep unique unit or lot identity and a known route. Separate incomplete units at the reporting cutoff.
- Record each first attempt
Retain entry, first-pass outcome and subsequent disposition at every required gate.
- Reconcile the route
Explain scrap, rework, bypasses, parallel branches and missing records before multiplying yields.
- Report RTY beside recovery
Show starting units, first-pass survivors, eventual good output and rework effort separately.
Handle parallel paths and mixed products explicitly
If one family uses three stages and another uses five, one unweighted average of their RTYs can mislead. Calculate comparable route cohorts first, then combine their survivor and entrant counts for a clearly defined aggregate.
A unit that bypasses a stage should not be recorded as a first-pass success there unless the stage is genuinely not required for its route. Re-entry and merged assemblies require a documented definition of the finished unit and its history.
Keep RTY separate from OEE quality
OEE quality and RTY have different boundaries. A machine-level OEE calculation does not automatically describe first-pass passage through an entire multi-stage route.
A useful quality review asks how many units succeeded without extra work, how many were eventually accepted, and how much recovery consumed capacity. RTY answers the first question. It needs the other two for a sound improvement decision.
Practical checklist
- Define the finished unit and required route.
- Use one starting cohort with unique identities.
- Retain first-attempt outcomes at each stage.
- Exclude re-entry from first-pass survivors.
- Use conditional yields from consistent populations.
- Explain parallel paths and incomplete units.
- Calculate from counts before rounding percentages.
- Report final yield and rework effort separately.
FAQ
FAQ
Sources and further reading
Authoritative references used to research and verify this guide.