

Cp compares a process’s six-sigma spread with the width between specification limits. Cpk also accounts for how close the process mean is to the nearest limit. Calculate these indices only with a suitable, stable process model and a clearly defined estimate of variation. A high Cp with lower Cpk points to an off-centre process. Neither index by itself proves long-term quality, measurement accuracy or compliance with a customer’s acceptance rules.
Calculate Cp and Cpk from declared millimetre inputs.
Separate centring problems from excessive variation.
Know when a capability number is not trustworthy.
Start with specifications, not control limits
A drawing or customer agreement sets specification limits. Statistical control limits describe how the process has behaved. Moving one to resemble the other changes the question rather than fixing the process.
NIST frames capability as a comparison between a stable process and its specifications. First check the measurement system and time-ordered data. A calculation across tool changes, materials or unexplained shifts can hide several different processes inside one standard deviation.
This guide answers the capability calculation. Control charts address stability; Gage R&R addresses measurement variation.
Two indices, two practical questions
Let USL and LSL be the upper and lower specification limits, μ the process mean, and σ the standard deviation used to describe within-process variation. Keep all three dimensional quantities in the same unit.
Cp asks whether the spread could fit between the limits if centred. Cpk uses the smaller distance from the mean to either limit. A mean outside a limit produces a negative side index; do not hide that result by taking an absolute value.
Cpk = min[(USL − μ)/(3σ), (μ − LSL)/(3σ)]. State how sigma was estimated and why the process model is appropriate.
A shaft that drifts toward the upper limit
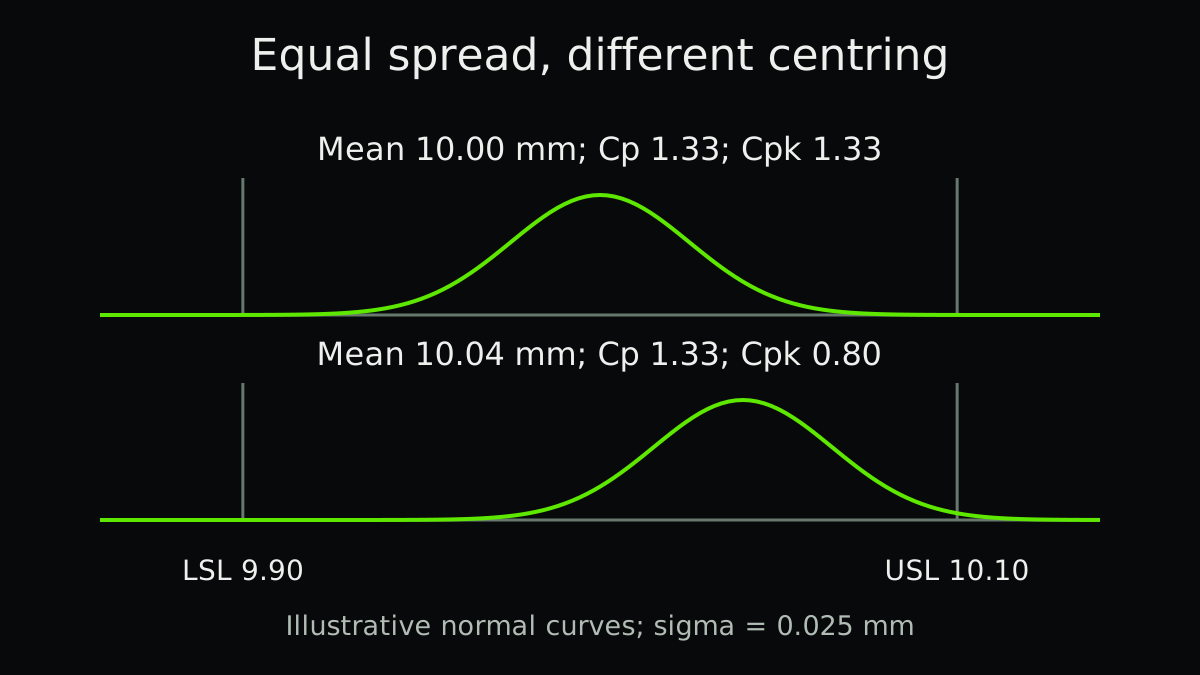
Illustrative example: a shaft diameter has limits of 9.90 and 10.10 mm. A suitable within-process estimate gives σ = 0.025 mm. The six-sigma spread is 0.150 mm, compared with a 0.200 mm specification width.
At a mean of 10.00 mm, each limit is 0.100 mm away. Cp and Cpk both equal 1.333 before rounding. If the mean moves to 10.04 mm while σ remains unchanged, the upper distance falls to 0.060 mm. Cpk becomes 0.060 / 0.075 = 0.80.
| Teaching scenario | Mean | Cp | Cpk |
|---|---|---|---|
| Centred | 10.00 mm | 1.33 | 1.33 |
| Shifted upward | 10.04 mm | 1.33 | 0.80 |
Choose and disclose the variation estimate
A capability report should identify subgrouping, sample size, period and estimator. Within-subgroup variation and overall variation can differ when the process drifts. Software often labels overall indices Pp and Ppk; check its definitions rather than assuming every report uses the same sigma.
The conventional formulas assume a suitable distribution, commonly normal, and representative observations. Strong skew, mixtures or autocorrelation need a justified alternative analysis. An automated normality checkbox cannot establish that the sample represents future production.
- Verify the measurement process
Check resolution, calibration, repeatability and the operators or instruments represented.
- Check time-ordered behaviour
Investigate special causes before estimating a stable-process capability. Keep different conditions separate when necessary.
- Calculate with traceable inputs
Record limits, units, mean, sigma method, sample size and date range. Retain unrounded values.
- Compare with the actual requirement
Use the applicable customer or internal acceptance rule and appropriate uncertainty, not an unexplained universal cutoff.
Do not turn 1.33 into a universal pass mark
Some contracts specify index thresholds. Others require particular sampling, confidence, measurement studies or methods for non-normal data. Follow the requirement for this characteristic and application.
An estimated Cpk is uncertain, especially from a small sample. NIST discusses confidence limits for capability indices. A point estimate just above a contractual boundary can be much less reassuring than the displayed decimals suggest.
A capable historical sample also cannot prove tomorrow’s output will stay acceptable. Continue monitoring the process and confirm actual first-pass yield.
Keep capability connected to a decision
For a stable but off-centre process, a documented centring investigation may help. For excessive spread, focus on the sources of variation. If the process is unstable, resolve that instability before advertising a capability number.
Use capability alongside inspection results, failure consequences and sampling coverage. Predictive quality adds another evidence layer, but a model score cannot repair misleading measurement inputs.
Practical checklist
- Confirm the current specification revision.
- Keep units consistent.
- Check the measurement system.
- Inspect time order and process stability.
- State the distribution and sigma estimator.
- Separate materially different production conditions.
- Record sample size and estimation uncertainty.
- Apply the actual acceptance agreement and keep monitoring.
FAQ
FAQ
Sources and further reading
Authoritative references used to research and verify this guide.