

A manufacturing KPI tree links business outcomes to the process measures and operating drivers that explain them. Level 1 is customer and business results such as on-time in-full and cost. Level 2 is flow: throughput, lead time and WIP. Level 3 is process performance: OEE, yield, downtime. Level 4 is drivers such as stop reasons and defect modes. A dashboard shows numbers. A KPI tree shows what moved which number.
A reusable four-level tree with example KPIs at every level
A worked trace from a late delivery to a root driver
A downloadable diagram to adapt to your plant
A one-page version of the tree with room to note each KPI’s owner, formula and data source.
SVGVrolen manufacturing KPI treeThe four-level tree from this page as a scalable diagram you can edit or print.
A dashboard is not a KPI system
The useful question is not “what should we display?” but “what explains movement in the outcome, and what decision changes because of it?” A list of 40 metrics does not answer that. A tree does, because every measure sits under the outcome it helps explain.
NIST research on manufacturing KPIs makes the same point: measures are interdependent, so a hierarchy is needed to reason about them. This page gives a practical version. For the governance side, see operational excellence metrics.
The four levels
Start at the top with what the business and customer care about, and work downward to what a team can change on a shift.
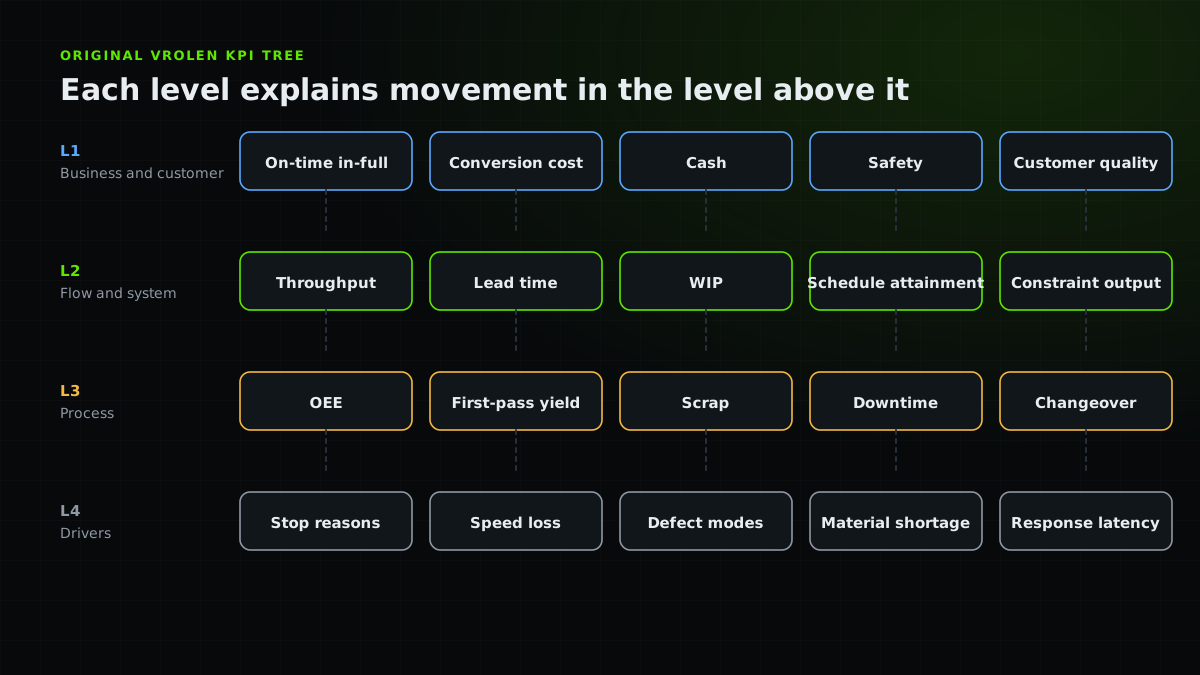
| Level | What it answers | Example KPIs |
|---|---|---|
| 1. Business and customer | Are we delivering what the business needs? | On-time in-full, conversion cost, cash, safety, customer quality |
| 2. Flow and system | How well does work move through the plant? | Throughput, lead time, WIP, schedule attainment, constraint output |
| 3. Process | How well do individual processes perform? | OEE, first-pass yield, scrap, downtime, changeover, cycle variation |
| 4. Drivers | What specifically causes the movement? | Stop reasons, speed loss, defect modes, material shortage, response latency |
Worked example: on-time delivery falls
On-time in-full drops from 96% to 88%. The reflex is to demand higher utilization everywhere. The tree points somewhere more useful.
Trace the fall down the levels. Each step is a measure you can check, and each one either confirms the path or rules it out.
- Level 1
On-time in-full falls.
- Level 2
Finished-goods schedule attainment falls, and constraint throughput is below plan.
- Level 3
Constraint availability is down, and the top downtime reason is material starvation.
- Level 4
Starvation events cluster after a specific supplier’s deliveries. The intervention belongs in upstream replenishment, not in machine speed.
Rules for building your own tree
Keep the tree small enough that everyone can read it, and make every link a claim you can test.
- Write the causal logic for every link, for example “constraint availability drives throughput”.
- Give each KPI one owner, one formula and one data source.
- Note the known trade-off for each KPI, such as utilization versus lead time.
- Limit the tree to the measures that lead to a decision. Remove the rest.
- Review the links after every major change: products, layout, shifts, definitions.
When a KPI tree lies to you
A tree can imply causality that is not there. Two measures that move together are not necessarily linked, and a tree drawn once and never tested becomes decoration. Treat every branch as a hypothesis, and check it against events, not averages.
The manufacturing data analytics guide covers how to keep the data behind each branch trustworthy, and predictive quality shows how quality measures connect to process conditions.
Common mistakes when building a KPI tree
These are the mistakes that turn a tree back into a dashboard.
- Copying a list of “best” KPIs from a template instead of starting from your own outcomes.
- Mixing levels, for example putting a machine metric beside a customer metric with no stated link.
- Letting one KPI carry different definitions in different plants.
- Adding a KPI whenever a problem appears and never retiring one.
- Treating the tree as fixed after a change in product, layout or shift pattern.
Practical checklist
- Start from outcomes the business and customer care about.
- Limit each level to five or six measures.
- Write the causal claim for every link between levels.
- Assign one owner, formula and data source per KPI.
- List the known trade-off beside each KPI.
- Test each branch against event data, not only averages.
- Remove any KPI that leads to no decision.
- Review the tree after major changes to product, layout or definitions.
FAQ
Questions before you join
Sources and further reading
Authoritative references used to research and verify this guide.