
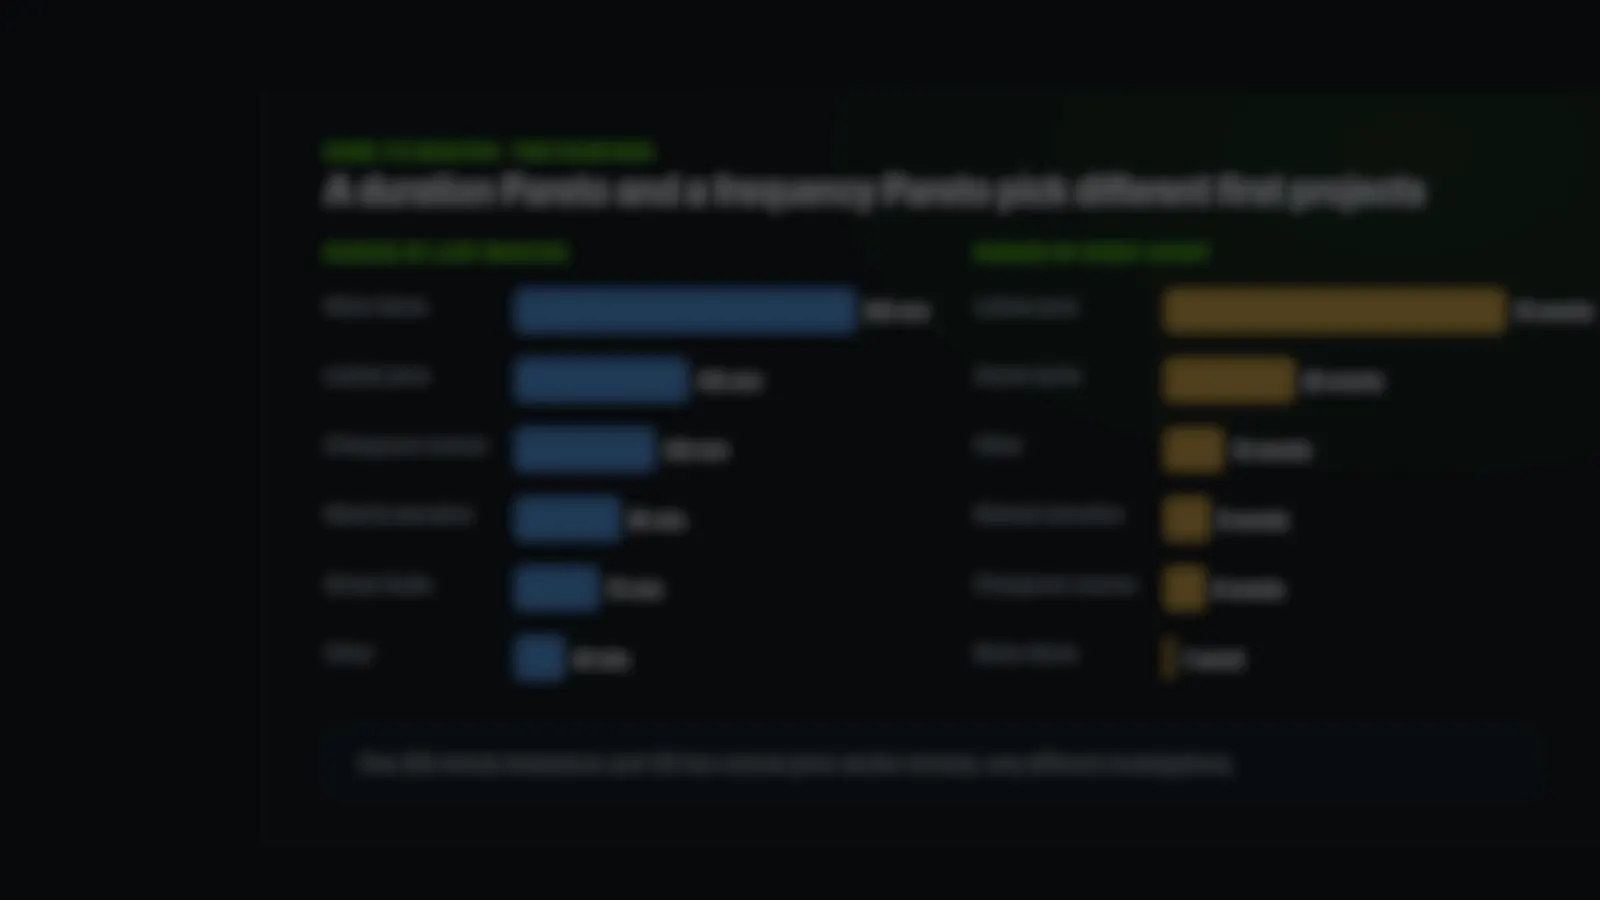
Build two Pareto charts from the same downtime events: one ranked by total lost minutes and one ranked by number of events. They often pick different reasons, and you need both. Use a stable three-level reason hierarchy, record where a stop started separately from where it was felt, and segment before you rank. A Pareto tells you where to investigate. It is not the root cause.
Two rankings that expose different problems
A reason hierarchy operators can use without diagnosing
A CSV event template and a reason-code taxonomy to download
The columns you need for a trustworthy Pareto, with three sample rows.
PDFDowntime reason-code guideRules of use and the full taxonomy on two printable pages.
CSVDowntime reason-code taxonomyA three-level hierarchy of loss families and mechanisms to adapt.
Start with two Paretos, not one
A duration Pareto ranks total lost minutes by reason. A frequency Pareto ranks the number of events by reason. You need both, because a single 300-minute breakdown and 150 two-minute jams are the same amount of lost time and demand very different improvement strategies.
The chart below uses one week of downtime on a packaging line, 770 minutes in total. The two rankings agree on almost nothing.
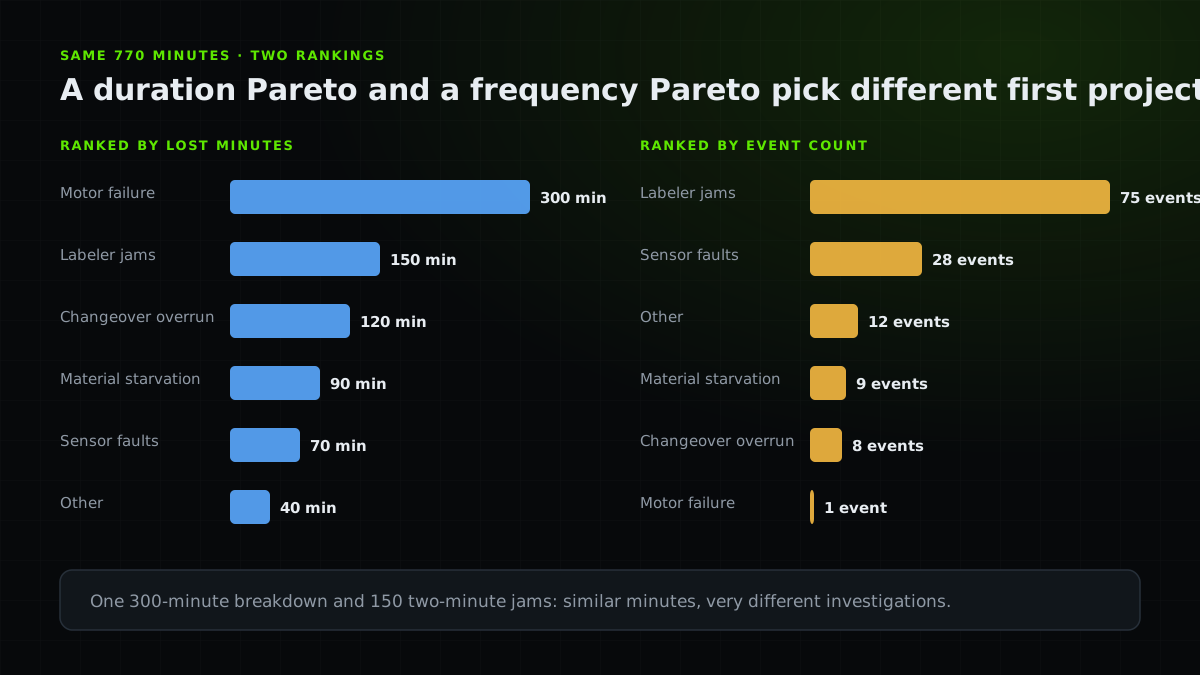
| Reason | Lost minutes | Events | What it suggests |
|---|---|---|---|
| Motor failure | 300 | 1 | A rare, long failure: reliability and spares |
| Labeler jams | 150 | 75 | Frequent small stops: root cause in the labeler |
| Changeover overrun | 120 | 8 | Method and standard work |
| Material starvation | 90 | 9 | Upstream supply and replenishment |
| Sensor faults | 70 | 28 | Frequent nuisance stops |
| Other | 40 | 12 | Review the coding, not the machines |
Build a stable reason hierarchy
Avoid hundreds of free-text reasons. They cannot be ranked, and operators cannot choose among them under pressure. Use layers, and do not ask anyone to diagnose the root cause while the line is still down.
- Level 1: loss family
Equipment, material, quality, changeover, labor, planning, upstream starvation, downstream blocking.
- Level 2: mechanism
Within equipment: electrical, mechanical, controls, tooling, sensor.
- Level 3: confirmed cause
Added only after investigation, and only where the loss justifies it.
Separate origin from impact
A packaging machine may record “starved” downtime, but the origin could be an upstream mixer. If every affected asset records the full loss independently, total lost minutes become meaningless because the same event is counted several times.
Model three things: the event origin, the impacted resources and the system loss. This is the same principle as in production downtime tracking, which is worth reading before you build the event table.
Segment before you rank
A plant-wide Pareto can hide context. Slice by product family, shift, line, machine mode, campaign and material family. Do not slice so finely that random noise becomes the top cause: 3 events in a tiny segment is not a pattern.
- Product family: does one product cause most of the stops?
- Shift or team: is it a method problem, not a machine problem?
- Machine mode: startup, steady state or changeover.
- Campaign or material family: is a specific input the trigger?
A Pareto is prioritization, not root-cause analysis
“Sensor fault = 28% of downtime” is a category. It is not the root cause. Use the Pareto to choose the investigation boundary, then use root-cause analysis or an A3 to find the cause and verify the fix.
Then check the consequence. A large bar on a machine with buffer protection may lose no shipments, while a small bar on the constraint loses output immediately. See MTBF vs MTTR for how to read the frequency-versus-duration pattern behind a bar.
Common mistakes with downtime Paretos
A Pareto is easy to build and easy to misread.
- Ranking only by minutes and missing frequent short stops.
- Letting “Other” become the largest bar.
- Counting the same event on every asset it affected.
- Comparing periods across a change in reason codes.
- Treating the top bar as the root cause.
Practical checklist
- Build one duration Pareto and one frequency Pareto.
- Use a three-level reason hierarchy with a small Level 1 list.
- Never require a root cause while the line is down.
- Record event origin, impacted asset and system loss separately.
- Segment by product, shift, line and mode before ranking.
- Ignore segments too small to be more than noise.
- Check whether the top bar affects the constraint.
- Turn the chosen bar into an investigation with an owner and a verification date.
FAQ
Questions before you join
Sources and further reading
Authoritative references used to research and verify this guide.