
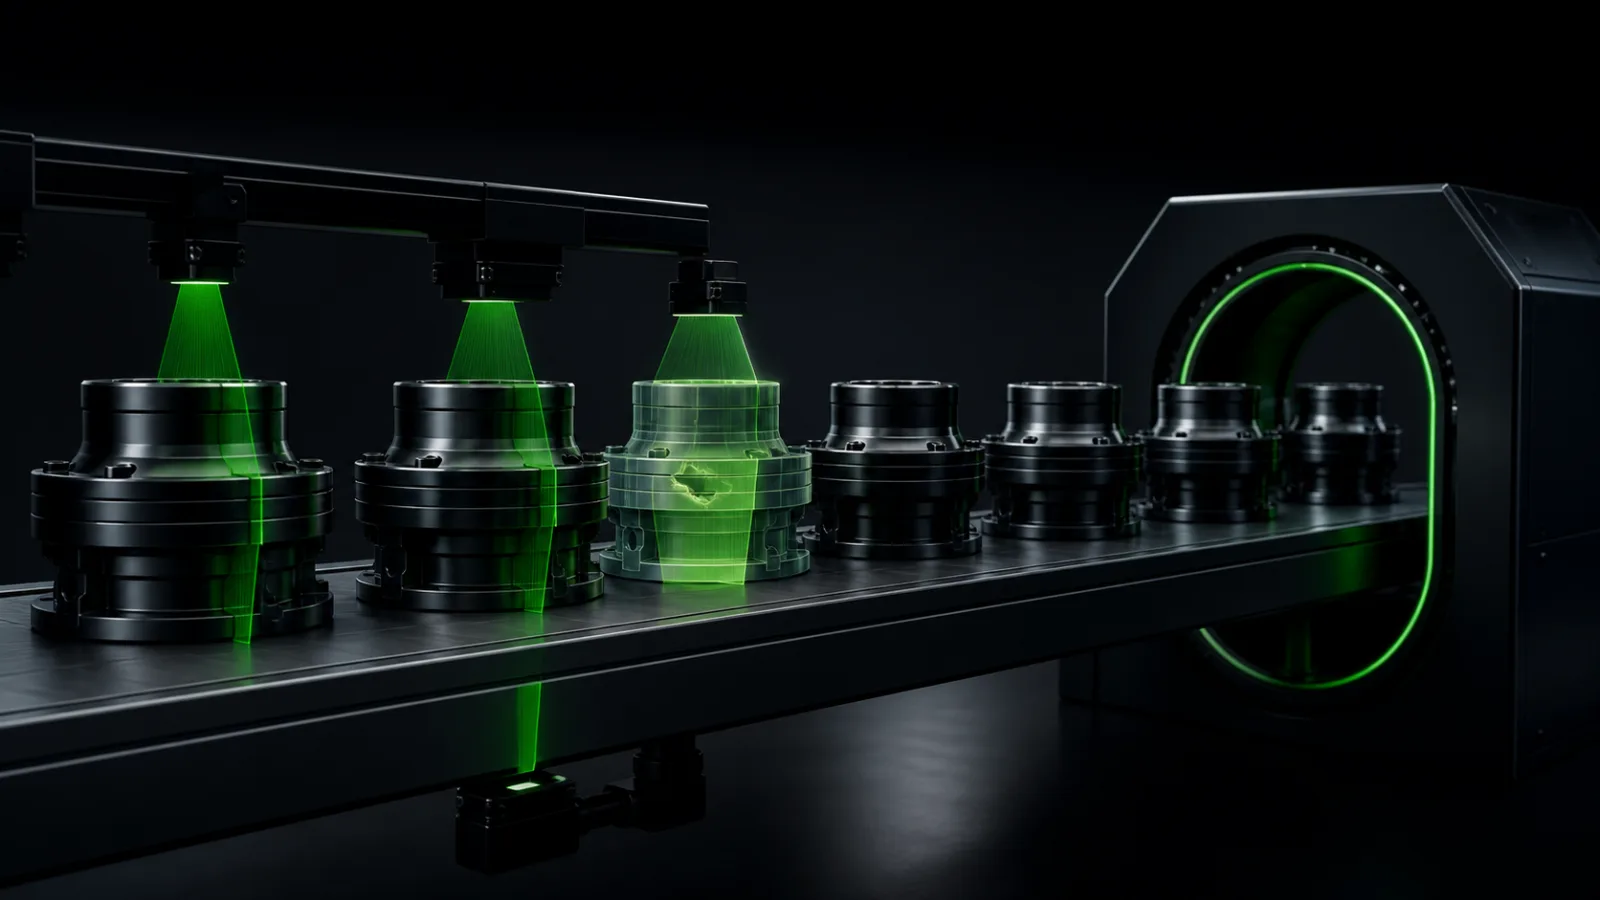
Predictive quality uses process, equipment, material, product, and inspection data to estimate the risk of a defect or out-of-spec condition early enough to support a safe intervention. It complements, not replaces, measurement, process control, and root-cause work. The model is valuable only when its warning is calibrated, explainable enough for the decision, and connected to a response that reduces total quality loss.
Quality risk detected before final inspection
Process and product context connected to defect evidence
Interventions evaluated by avoided loss, not model accuracy alone
Choose a defect and decision, not “predict quality”
Define the quality characteristic, specification, inspection method, unit of prediction, and action window. A model may predict risk for a cycle, part, batch, tool, or order. The decision might be to inspect, hold, adjust within approved limits, stop, or continue while collecting evidence.
Estimate the costs of a false negative, false positive, delayed signal, and unnecessary adjustment. High-risk products may require measurement or redundant evidence regardless of the model score.
Build trustworthy labels and causal context
Connect inspection and disposition results to the exact unit, batch, material lot, tool, machine, recipe, and time window that produced them. Include rework and customer returns without treating every later failure as proof of a production cause.
Avoid leakage: data created after the decision point, final inspection, disposition codes, rework route, or future alarms, must not enter training features. Split evaluation by time and production campaign so repeated parts from the same run do not appear in both training and test sets.
- Traceable part, batch, or time-window identity
- Process values and setpoints before the prediction moment
- Material, tool, product, recipe, environment, and machine state
- Confirmed inspection result, measurement uncertainty, and disposition
Use metrology and physics to strengthen machine learning
Machine learning can detect interactions that simple limits miss, but production data often contains drift, sparse failures, and changing regimes. NIST’s augmented-intelligence work combines integrated metrology and physics-based models with AI so predictions remain connected to measurable behavior.
Begin with control limits or a transparent baseline. Test calibration, precision, recall, lead time, and performance by product and regime. Explanations should help an engineer inspect plausible inputs; feature importance is not evidence of root cause.
Design the intervention and its safety boundary
For each risk band, define the evidence shown, allowed action, owner, and expiry. Use advisory mode first. Automatic setpoint changes require validated control limits, change management, fail-safe behavior, and clear responsibility.
Measure avoided scrap and escapes alongside extra inspection, false holds, rework, downtime, and process instability. Use simulation when the intervention changes flow, buffers, or constraint time.
- Signal
Estimate risk with a calibrated score and valid horizon.
- Review
Show relevant process context and uncertainty.
- Act
Inspect, hold, adjust, or stop within approved rules.
- Confirm
Capture measurement and physical evidence.
- Learn
Update labels, thresholds, and process knowledge.
Monitor the production system, not only the model
Track data drift, sensor changes, recipe revisions, maintenance, tooling, product launches, inspection changes, and operator overrides. Revalidate when the operating regime changes, not only on a fixed calendar.
A predictive-quality program succeeds when it shortens detection, reduces total quality cost, and improves process understanding. If it only routes more parts to inspection, it may be moving the problem rather than controlling it.
A related example from Abolfazl
Translate detector accuracy into part outcomes and the cost of each outcome.
In English, on founder Abolfazl’s personal blog. This is related reading, not an independent technical source.
Practical checklist
- Define the defect, unit of prediction, horizon, and allowed action.
- Link process conditions to confirmed inspection evidence.
- Exclude information created after the decision point.
- Evaluate by time, product, machine, and operating regime.
- Compare with a transparent rule or control-chart baseline.
- Pilot in advisory mode and account for false holds and disruption.
- Revalidate after product, process, sensor, or inspection changes.
FAQ
FAQ
Sources and further reading
Authoritative references used to research and verify this guide.