
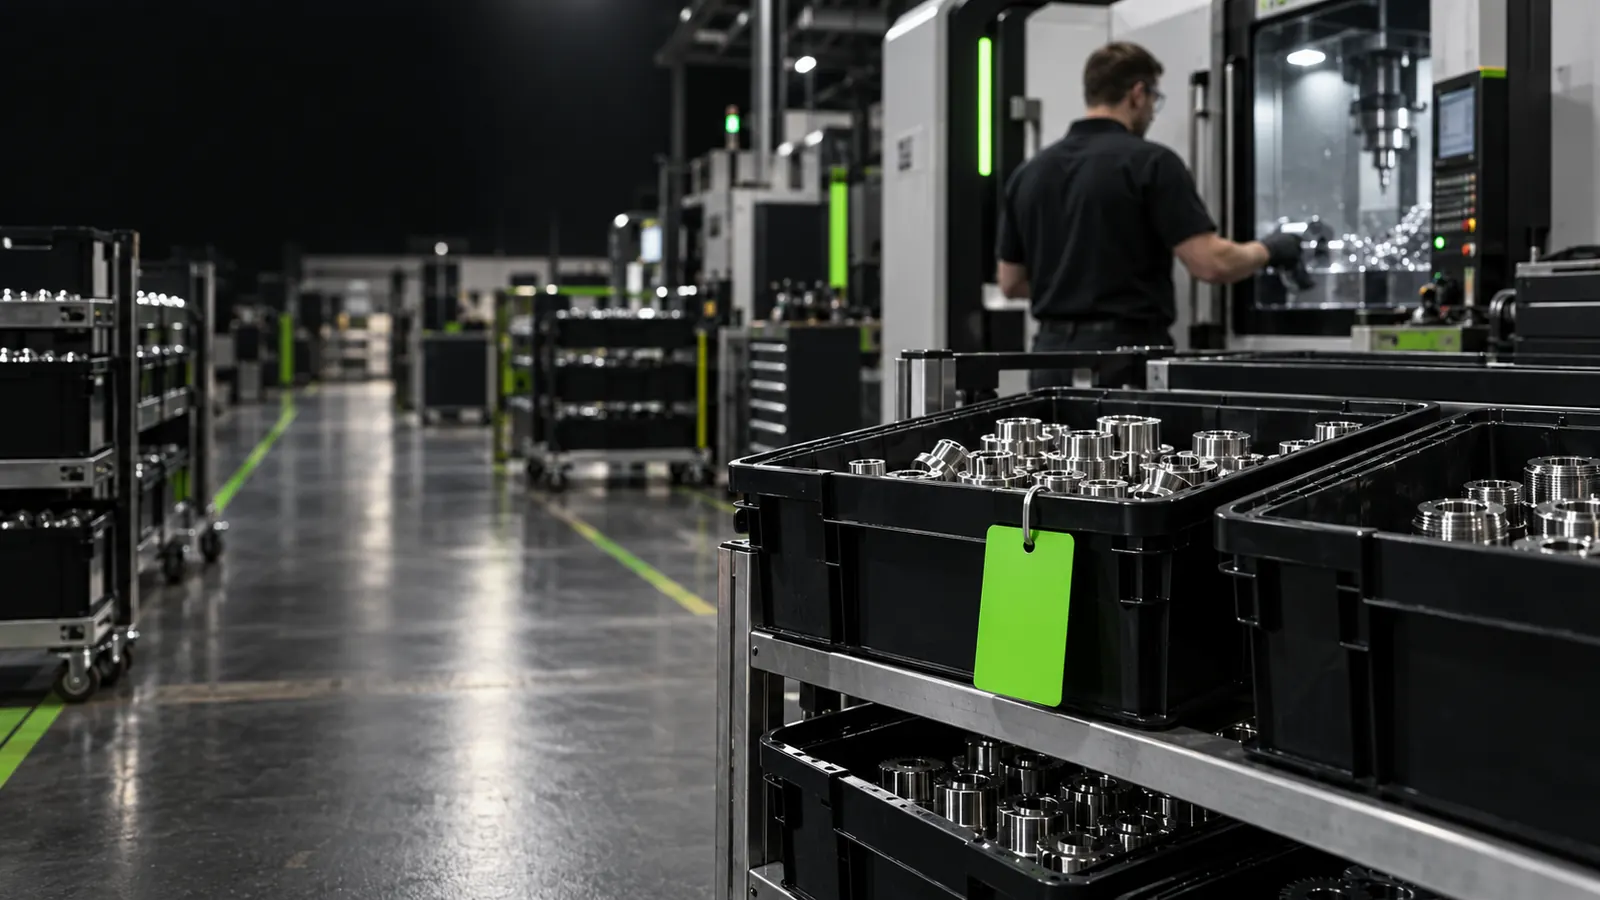
For a simple container-based replenishment loop, calculate kanban cards as demand rate multiplied by replenishment lead time and a stated safety allowance, divided by units per container. Round up to a whole card. Keep demand and lead time in matching time units. This is a starting inventory estimate, not proof that the loop will prevent shortages. Measure actual replenishment delays, separate production from withdrawal signals, and revise the allowance from observed service and stock.
Calculate the stock authorized by a defined card loop.
Spot lead-time and safety-stock double counting.
Test a smaller loop without hiding shortages.
Define what one card authorizes
In manufacturing, a kanban signals permission to produce or move a specified quantity. The Lean Enterprise Institute distinguishes production kanban from withdrawal kanban. A task board with columns does not answer how much physical inventory a machining cell should hold.
Write the part number, supplying process, consuming process and container quantity before calculating anything. A returned card must mean the same thing to the operator, material handler and planner. Digital signals need the same discipline as paper cards.
This guide sizes one replenishment loop. Use value stream mapping to locate it and Little’s Law to examine broader flow; neither replaces the card authorization rule.
Calculate coverage in units first
Let D be average demand in units per working hour, L the elapsed working hours from consumption signal to usable replenishment, s a declared fractional allowance, and C units per container. Include queueing, transport and release delays in L, not just machine cycle time.
The allowance in this simple model is a planning assumption. A 20% value has no automatic statistical service guarantee. If you already added safety units to the numerator, do not multiply by another safety factor without explaining why.
ceil means round upward to a whole card. Authorized inventory = K × C. All demand and time units must match.
An 18-card loop, and what changes it
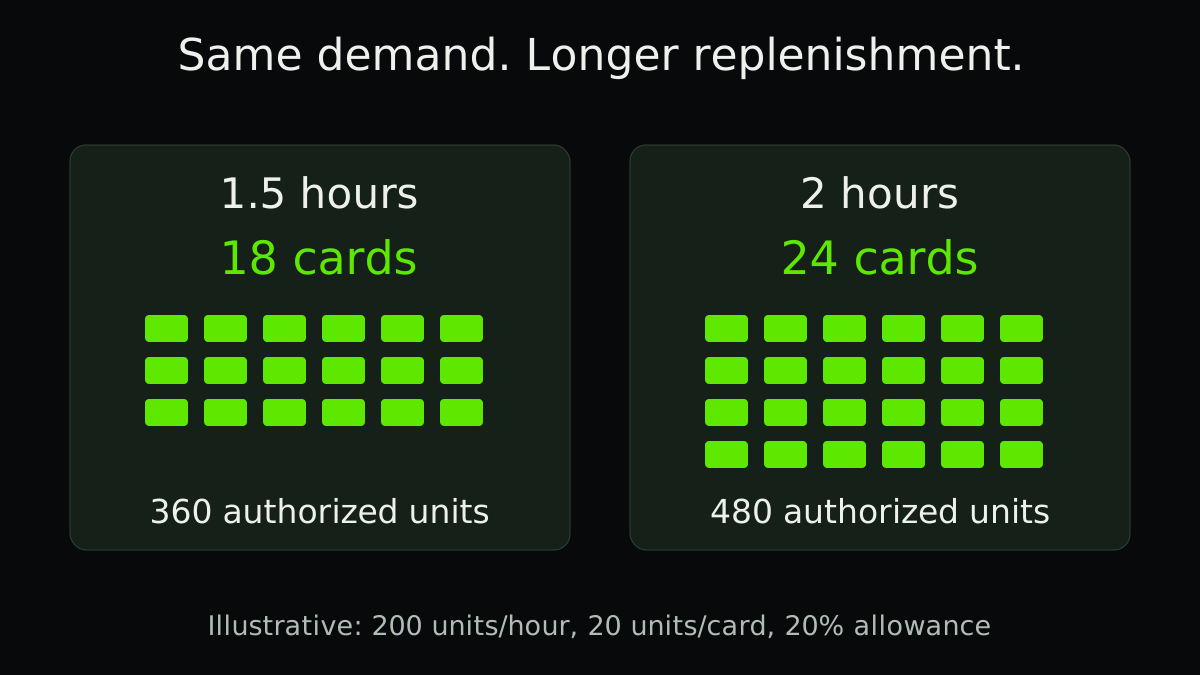
Illustrative example: one part is consumed at 200 units per working hour. Replenishment takes 1.5 working hours. Containers hold 20 units and the team initially allows 20% extra coverage. Demand and container sizes are held constant for this teaching case.
Coverage is 200 × 1.5 × 1.20 = 360 units. Dividing by 20 gives 18 cards. That is the authorized quantity across the defined loop, not 360 units at every location. Count containers in use, replenishing and waiting according to the loop design.
| Replenishment condition | Coverage calculation | Cards | Authorized units |
|---|---|---|---|
| 1.5 hours | 200 × 1.5 × 1.20 | 18 | 360 |
| 2 hours | 200 × 2 × 1.20 | 24 | 480 |
| 1.5 hours, 30-unit containers | 360 / 30 | 12 | 360 |
Check the route on the shop floor
Record signal time and the time a replacement container becomes usable at the consuming point. A receipt in the warehouse is too early if the material still needs inspection or internal transport.
Separate normal cycles from exceptional delays. Averages can under-cover a route with frequent long tails. High-mix lines also need a replenishment sequence: a card cannot create capacity for a product that will not run until Friday.
- Observe several replenishments
Capture demand, signal, queue, production, inspection and delivery times for the same part family.
- Set a documented initial allowance
Name the variability it covers and the service failure it is meant to avoid. Do not copy another line’s percentage.
- Pilot a bounded card count
Agree shortage reporting and recovery with the planner; keep safety and customer commitments under competent site control.
- Review stock and misses together
Track shortage frequency, recovery effort, full and empty containers, and unauthorized production before resizing.
Avoid a separate safety pile outside the loop
Unlabelled emergency stock makes the card count look lean while total inventory remains high. Inventory kept outside the loop should have an explicit purpose, owner and review date.
For intermittent demand, minimum supplier lots or long campaigns, a single average-rate formula may be a poor fit. Consider product-family supermarkets, order-driven replenishment or a separately designed buffer. The lean manufacturing guide explains pull principles; this calculation assumes the chosen part is suitable for replenishment.
Use digital kanban to improve the record
An electronic card can retain signal timestamps, failed acknowledgements and container identity. Those records help distinguish lost signals from genuinely inadequate coverage. Count one authorization once even if a message is retried.
A useful first improvement is often shorter and more predictable replenishment, followed by a controlled reduction in cards. State the shortage risk and review period before changing a live line.
Practical checklist
- Define the supplying and consuming points.
- Confirm units in each container.
- Use demand and lead time in matching working-time units.
- Include inspection, queue and transport delays.
- Declare the safety allowance and its purpose.
- Round cards upward only after calculating coverage.
- Count all authorized inventory, including replenishing containers.
- Review shortages and actual stock before changing the count.
FAQ
FAQ
Sources and further reading
Authoritative references used to research and verify this guide.