

 Abosh
To reduce supply chain lead time, define the order boundary, follow real orders through every handoff and separate active work from waiting. Then test the delay you can actually change. Supplier queues, approvals, batch rules, transport schedules and receiving all affect the result. A faster local step helps only if accepted customer receipt moves earlier without unacceptable stockouts, cost, quality or workload elsewhere.
Calculate elapsed stage time from one traceable order record.
Choose a delay-reduction trial without guessing from department averages.
Protect service and quality while checking whether stock or cost moved elsewhere.
Choose one start and one finish across the chain
For this guide, lead time runs from an authorized purchase release to accepted receipt at the customer boundary. Another contract may measure order placement to dispatch, or supplier acceptance to warehouse availability. Name the boundary before comparing figures.
Keep the same order or lot ID through the route. Record event time, time zone, quantity and acceptance state. An order that reaches a dock with missing documents may still be unavailable. GS1 EPCIS specifies how systems can share visibility events. The teams exchanging those events still need to agree what each one means in their operation.
A Lean supply-chain approach examines value and flow across those boundaries. It does not mean keeping zero stock regardless of uncertainty. Use the three-clocks guide for the definitions, rather than using a machine cycle time as an order promise.
Work through an order with five visible stages
Fictional example: all timestamps below are UTC in October 2026. The order is released on October 1 at 08:00 and accepted on October 8 at 08:00. These are elapsed calendar hours; weekends remain in the clock. Each row ends exactly where the next begins.
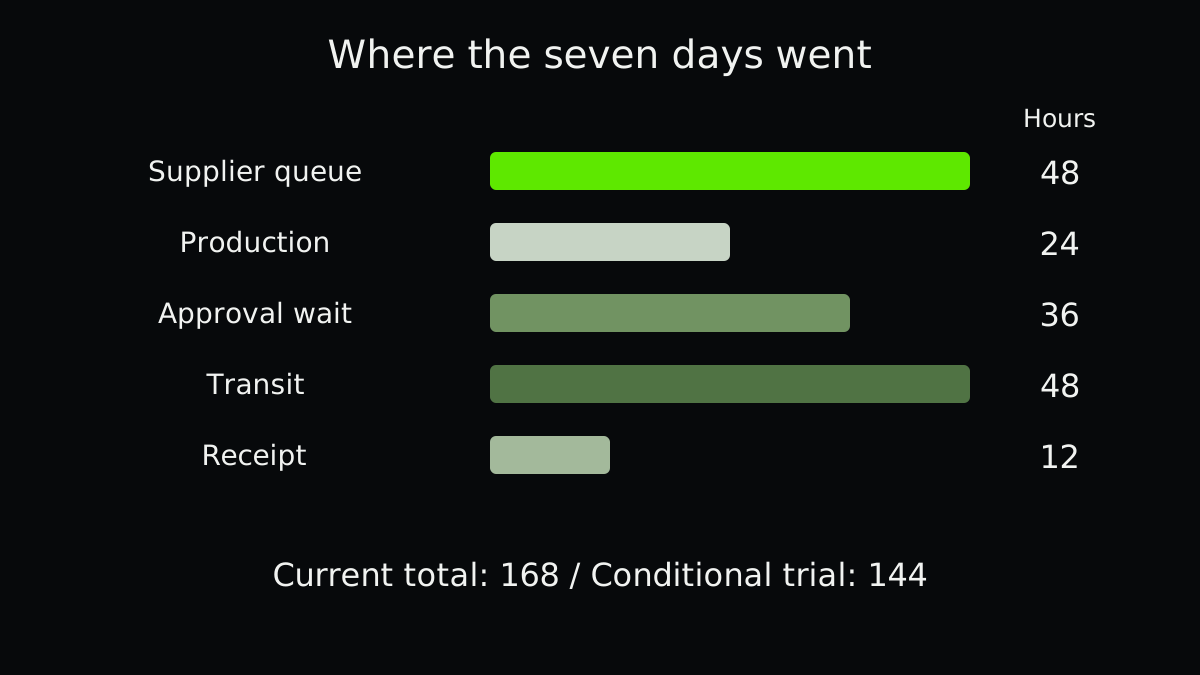
| Stage | Start to finish, October | Elapsed hours |
|---|---|---|
| Supplier queue | 1st 08:00 to 3rd 08:00 | 48 |
| Production | 3rd 08:00 to 4th 08:00 | 24 |
| Release approval wait | 4th 08:00 to 5th 20:00 | 36 |
| Transit | 5th 20:00 to 7th 20:00 | 48 |
| Receiving and acceptance | 7th 20:00 to 8th 08:00 | 12 |
| Complete boundary | 1st 08:00 to 8th 08:00 | 168 |
Test the dependency, not just the approval clock
Suppose the team proposes reducing approval waiting from 36 to 12 hours. Holding every other duration unchanged gives a 144-hour journey, a reduction of 24 hours or 14.3%. That is a calculated scenario, not an observed result.
Check the transport dependency. If the earlier approval misses the same fixed departure cutoff, customer receipt may not improve at all. Conversely, an earlier departure could change receiving hours. Write those rules into the proposed route instead of subtracting one day and announcing a saving.
Valid only if the changed approval actually enables the earlier downstream handoffs. No overlapping stages or time-zone changes are assumed.
Choose a change for the delay you observed
Different delays call for different experiments. Improve order readiness when missing information holds supplier release. Review transfer batches when completed work waits to accumulate. Align an approval window with a transport cutoff when those events interact.
Do not reduce a safety buffer simply because its stock looks expensive. Demand, replenishment variability and service requirements determine the protection needed. The Kanban calculation covers a defined replenishment loop; OTIF checks whether delivery met the agreed promise. Neither can replace tracing this order.
- Collect complete journeys
Include fast, slow, late, partial and rejected orders over a stated period.
- Validate the largest waits
Check event definitions with supplier, planning, logistics and receiving.
- Test one changed rule
State the predicted next departure and acceptance, plus a stop condition.
- Check comparable orders
Compare lead time and its slow tail alongside service, quality, inventory and total cost.
Keep the slow and unfinished orders visible
A completed-order average excludes whatever is still waiting. Report open-order age separately, keep partial deliveries linked and examine the slow tail as well as the median. Separate product families or transport modes when the routes differ materially.
Use comparable periods and the same customer promise. Faster delivery of easy orders is not a clean comparison with a period full of custom work. Keep expedite fees, supplier pressure, stockouts and rejected receipts beside the timing result.
If the trial works, agree the new rule with the teams responsible and keep a review date. If the delay moves to another queue, revise the route. Lead-time reduction is useful when the customer gets the right work sooner and the rest of the chain can sustain it.
Four supply-chain strategies describe uncertainty, not four industries
Hau Lee’s 2002 model distinguishes efficient, risk-hedging, responsive and agile supply-chain strategies by uncertainty in demand and supply. A planning team can use those two questions to examine its choices. A network may need a different strategy when its demand or supply conditions change.
| Demand uncertainty | Supply uncertainty | Lee’s strategy |
|---|---|---|
| Low | Low | Efficient |
| Low | High | Risk-hedging |
| High | Low | Responsive |
| High | High | Agile |
Use the current SCOR process names when counting stages
ASCM’s SCOR Digital Standard has Orchestrate at Level 0 and six Level 1 processes: Plan, Order, Source, Transform, Fulfill and Return. Those seven process areas form a network, not seven steps that every order must follow in sequence.
The older Plan, Source, Make, Deliver and Return summary explains many “five pillars” lists, but it omits other work and should not be presented as the complete current SCOR model. Name the version. For a lead-time investigation, trace the actual order, material and return paths, including planning decisions and supplier waits.
The 7Cs and 5Cs answer different supply-chain questions
Vereecke, Van Steendam and Van den Broeke’s 2016 paper proposes seven growth practices: Connect, Create, Customise, Coordinate, Consolidate, Collaborate and Contribute. The authors studied 16 European companies and found examples of all except Contribute. They used the list to study growth; they did not describe seven steps for processing an order.
For analytics, ASCM describes a different 5Cs model from a 2020 IDC report sponsored by IBM: connected, collaborative, cyberaware, cognitively enabled and comprehensive. That model concerns data and digital capabilities. It is not proof that a plant needs AI, or a general definition of all supply-chain management.
Choose a model for a question your team needs to answer. For example, test whether combining deliveries reduces transport cost without extending order lead time. Compare the cost and timing results before changing the delivery rule.
Dock-to-stock and usable-stock time can finish at different events
APQC defines dock-to-stock from supplier-delivery receipt to put-away after inventory-system recording. A site may still hold that stock for quality release. Name whether your clock ends at recorded put-away or at authorized availability for the next user.
In this fictional receipt, unloading begins at 08:00, recording finishes at 10:00, put-away at 11:00 and a quality hold clears at 13:00. The defined dock-to-stock journey is 3 hours; receipt-to-usable stock is 5 hours. Both include waiting and work. Recording the delivery does not prove it was available at 10:00.
A local receiving checklist might cover unloading, checking, recording, put-away and release. That is one practical grouping, not five compulsory processes for every warehouse. Keep partial receipts, unresolved holds and the time zone visible; a completed-receipt average alone can hide what is still waiting.
| Illustrative event | Time |
|---|---|
| Receipt starts | 08:00 |
| Recorded | 10:00 |
| Put away | 11:00 |
| Quality release | 13:00 |
Which inventory cycle are you calculating?
An operational replenishment cycle follows named events, such as a signal for more stock through to usable replacement. Subtract its start timestamp from its finish on a consistent clock. Include transport and acceptance when they sit inside that boundary.
Inventory days derived from turnover answers a different accounting question: how much average inventory is held relative to the consumption or cost-of-sales rate. Match quantities or monetary cost bases and the reporting period before calculating it. That ratio does not establish how long a particular supplier order took. Use the order-event record for delivery time and keep unfinished orders visible.
A related example from Abolfazl
Compare active work with waiting in a separate order-flow example.
In English, on founder Abolfazl’s personal blog. This is related reading, not an independent technical source.
Practical checklist
- Set purchase-release and accepted-receipt events.
- Use one order ID, time zone and calendar.
- Retain missing, partial and rejected journeys.
- Calculate non-overlapping stage durations.
- Check approval and transport cutoffs together.
- Choose one reversible delay-reduction trial.
- Track stockouts, quality, stock and total cost.
- Review slow orders and standardize only a supported result.
FAQ
FAQ
Sources and further reading
Authoritative references used to research and verify this guide.
- GS1EPCIS and CBV Linked Data Model
- Lean Enterprise InstituteJust-in-Time Production
- Lean Enterprise InstituteValue Stream Mapping
- Hau Lee / California Management ReviewAligning Supply Chain Strategies with Product Uncertainties (2002)
- ASCMSCOR Digital Standard: Introduction to Processes
- ASCMSCOR Digital Standard Quick Reference Guide
- Vereecke, Van Steendam and Van den Broeke / JMDCThe 7 Cs of Supply Chain Management: Practices for Profitable Growth (2016)
- ASCMSupply Chain Analytics: Five Cs
- APQCDock-to-stock cycle time in hours for supplier deliveries
- SAP Help PortalMRP Procedures, SAP S/4HANA