

 Abosh
The bullwhip effect is an increase in order variability as demand information moves upstream through a supply chain. Customer sales and supplier orders can tell very different stories, even when their averages match. Compare the same products over matched periods, then inspect ordering rules, batches, forecast changes and shortage behavior. A spiky order chart is a starting observation, not proof of its cause. The useful response depends on which decision created the uneven releases.
Compare variability without mistaking equal averages for equal demand patterns.
Separate batching, forecast updates and genuine changes in customer use.
Test one release rule while protecting service and inventory.
Trace orders back to customer use
A distributor may sell a fairly steady quantity while ordering in large bursts. Its supplier sees the bursts and makes its own planning decisions. Another tier can amplify the signal again. That upstream distortion is the supply-chain meaning of bullwhip.
The original publisher summary of Lee, Padmanabhan and Whang’s 1997 article names forecast updating, order batching, price fluctuations and rationing behavior as mechanisms. It does not establish how common any one cause is in your operation. Match the order record with its rules and underlying demand before choosing a remedy.
Equal totals can hide very different variability
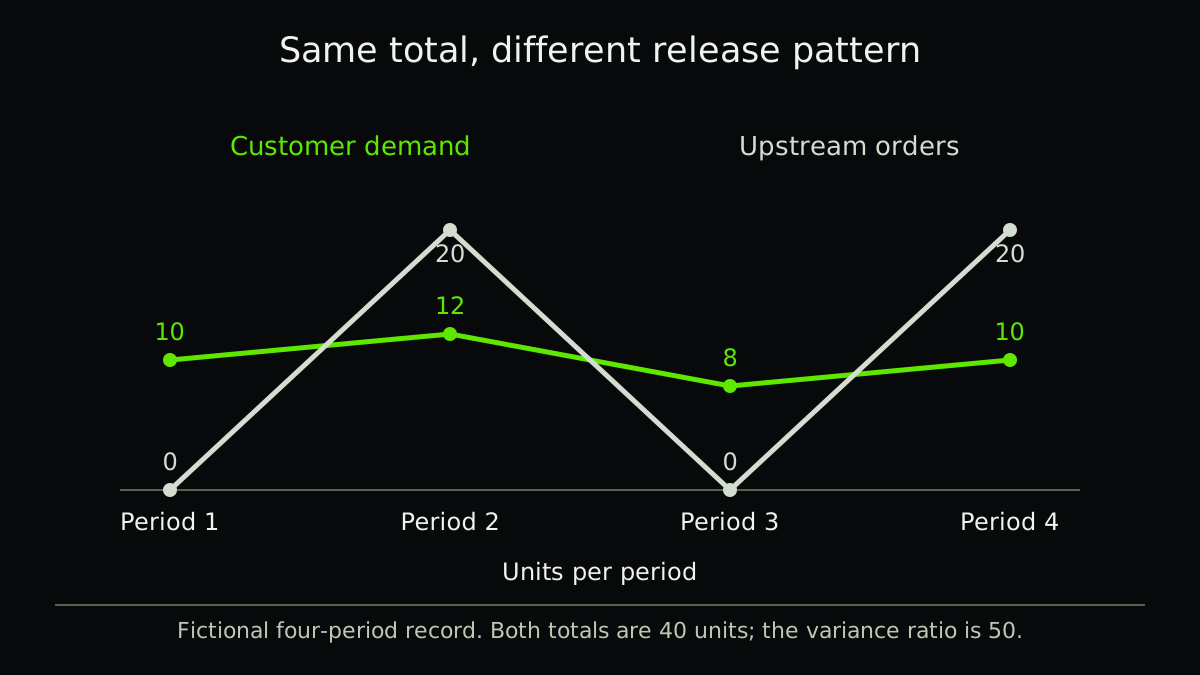
Consider four fictional periods for one product. Customer demand is 10, 12, 8 and 10 units. Orders sent upstream are 0, 20, 0 and 20 units. Both total 40 and average 10 units per period. The release pattern is plainly different.
Using population variance for this complete four-period teaching record, demand variance is 2 square units and order variance is 100 square units. The ratio is 50. That illustrates amplification in these inputs; four observations cannot establish a stable long-run estimate or identify a cause.
| Period | Customer demand, units | Upstream orders, units |
|---|---|---|
| 1 | 10 | 0 |
| 2 | 12 | 20 |
| 3 | 8 | 0 |
| 4 | 10 | 20 |
Check the comparison before blaming a tier
Use the same product scope, units, time buckets and comparable observation window. Daily demand versus monthly orders is not a matched comparison. Distinguish orders, dispatches, receipts and consumption; a late delivery can shift a receipt spike without changing the ordering rule.
If customer-demand variance is zero, this variance ratio is undefined. Report the flat demand and changing orders directly rather than presenting an infinite score. Missing periods also stay missing, not silently zero. Promotions, introductions, cancellations and stockouts may need separate analysis.
Choose a test that matches the mechanism
If batching drives the pattern, compare a smaller release cadence with the actual transport, order-processing and setup costs. If forecast updates drive it, examine whether each tier is reacting to the same replenishment noise. Shared customer-use data can help, but it will not remove a real capacity or supplier constraint.
A leveling plan can make local releases more regular. The replenishment clock shows how long the loop must protect. Neither justifies promising no inventory or suppressing genuine demand.
- Align the records
Match product, units, periods and demand/order definitions.
- Identify the release rule
Retain batches, forecast changes, promotions and overrides.
- Change one rule in a bounded trial
State service, cost and inventory limits before starting.
- Review the full loop
Check upstream variability together with shortages, lateness and stock.
A smoother chart can still be a worse result
An order freeze can make a chart look calm while overdue demand grows. Keep unfilled demand, expedites and cancellations visible. Do not credit a new rule for a quiet period that had a different product mix or fewer orders.
The EPEI product-wheel guide examines the setup capacity needed for more frequent production. Use it when smaller upstream batches would require more changeovers. A sensible test keeps those physical consequences beside the information signal.
A related example from Abolfazl
Compare level quantity with uneven demand and the stock needed between days.
In English, on founder Abolfazl’s personal blog. This is related reading, not an independent technical source.
Practical checklist
- Match products and units across tiers.
- Use comparable complete time buckets.
- Separate customer use, orders and receipts.
- Keep promotions and overrides in the record.
- Declare the variance convention and sample limits.
- Leave a zero-variance ratio undefined.
- Test one plausible ordering mechanism.
- Review service, cost and stock as well as variability.
FAQ
FAQ
Sources and further reading
Authoritative references used to research and verify this guide.