
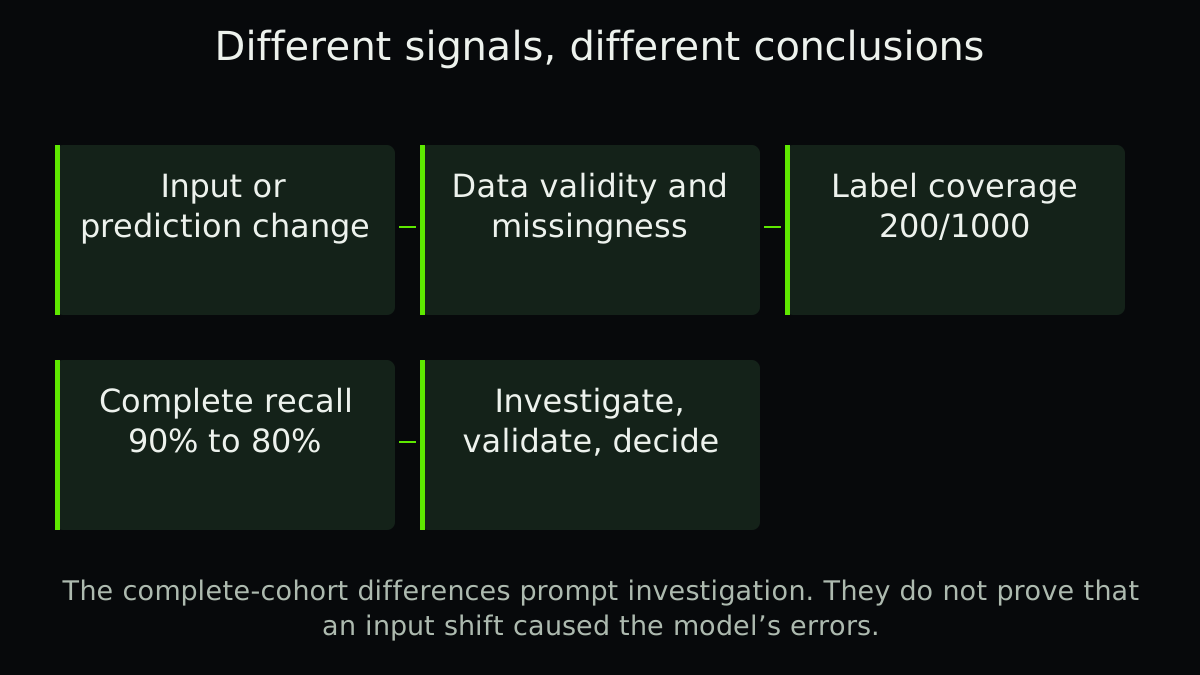
Monitor an industrial AI model by separating input quality, changes in input or prediction distributions and performance against later verified outcomes. A drift signal can prompt investigation without proving the model became worse; unchanged averages can also miss important failures. Keep label coverage, delay, product mix and the response owner visible. This fictional inspection example compares complete outcomes with an earlier incomplete snapshot, showing what can be concluded before deciding whether to investigate, recalibrate or retrain.
Keep a data-change alert separate from a performance conclusion.
Check delayed-label coverage before calculating error rates.
Attach a specific investigation and owner to a monitoring signal.
Name the signal before choosing an alert threshold
Microsoft’s model-monitoring documentation distinguishes data drift, prediction drift, data quality and performance measured against ground truth. These signals require different inputs. A changed camera brightness distribution can be a real data change without proving that defect detection deteriorated.
For a manufacturing decision, also retain missing images, invalid units, product revisions, lighting changes, camera settings, model version and threshold. A broken sensor feed is a different incident from a gradual change in the product population.
Keep the incomplete-label snapshot out of the scorecard
Our illustrative current cohort contains 1000 inspected parts. At the first review, only 200 have verified final outcomes. Those 200 were prioritized for review, so their labels are not a random representative sample of the remaining 800.
Report 200/1000 label coverage and the selection rule. Do not describe 200 labeled parts as all current production or assume the other 800 are good. The fictional record later receives outcomes for every part; only that complete cohort is used in the comparison below.
Compare complete cohorts with compatible definitions
The fictional baseline and completed current cohort each contain 1000 parts, including 50 reference-defective and 950 reference-good parts. The baseline detects 45 defects and misses 5, while falsely flagging 19 good parts. The current cohort detects 40, misses 10 and falsely flags 38 good parts.
Recall moves from 45/50 =90% to 40/50 =80%. False-positive rate moves from 19/950 =2% to 38/950 =4%. These observed differences warrant investigation in the teaching scenario. Small defect counts, sampling uncertainty and operating differences prevent a confident causal claim from the percentages alone.
Incomplete or selectively available labels cannot silently supply these full-cohort denominators.
| Complete-cohort outcome | Baseline | Current |
|---|---|---|
| Reference defective / good | 50/950 | 50/950 |
| True positives / false negatives | 45/5 | 40/10 |
| False positives / true negatives | 19/931 | 38/912 |
| Recall | 90% | 80% |
| False-positive rate | 2% | 4% |
| Parts flagged for review | 64 | 78 |
Investigate the change before retraining
Check input validity, reference-label method, product mix, image conditions, threshold version and workflow changes. A shifted brightness measure may suggest a camera or lighting investigation. Retraining first can hide a broken setup or teach the model a temporary fault.
Use AI drift guidance in the broader predictive-quality process and inspection-threshold analysis when the trade-off changed without new model weights. A threshold adjustment still needs validation and authority.
- Capture the operating version
Record camera, preprocessing, model, threshold and product context.
- Check data and label coverage
Separate invalid inputs, distribution changes and incomplete outcomes.
- Investigate a defined signal
Assign an owner and inspect plausible causes with representative evidence.
- Validate the selected response
Test repair, recalibration, retraining or no change against protected evaluation evidence.
Set monitoring cadence from consequences and evidence arrival
A model inspecting fast-moving production can require immediate input-quality controls, while final product outcomes may arrive days later. Use different response times for those signals. Do not wait for a weekly drift dashboard to handle missing mandatory inspection evidence.
Choose alert criteria and fallback behavior with the responsible quality and operations team. NIST’s AI Risk Management Framework treats measurement and risk management as ongoing activities. It does not supply a universal drift percentage that makes every manufacturing model safe.
Close the monitoring loop with an actual decision
Retain alert, investigation, action, authority and later result. “Drift detected” is not an operational outcome. Record whether the change affected customer risk, manual review workload or process availability, and what remains unknown.
The download keeps the incomplete snapshot apart from the two complete fictional matrices. Use the blank fields to name the person who will investigate an alert, the evidence they need and the action they can authorize.
A related example from Abolfazl
Check what changes when the same AI pilot moves to a second plant.
In English, on founder Abolfazl’s personal blog. This is related reading, not an independent technical source.
Practical checklist
- Version model, threshold and acquisition conditions.
- Check missing and invalid inputs first.
- Separate distribution change from measured error.
- Record label delay and selection.
- Use compatible complete-cohort denominators.
- Review uncertainty and product mix.
- Assign the response and approved fallback.
- Validate the action before closing the alert.
FAQ
FAQ
Sources and further reading
Authoritative references used to research and verify this guide.