
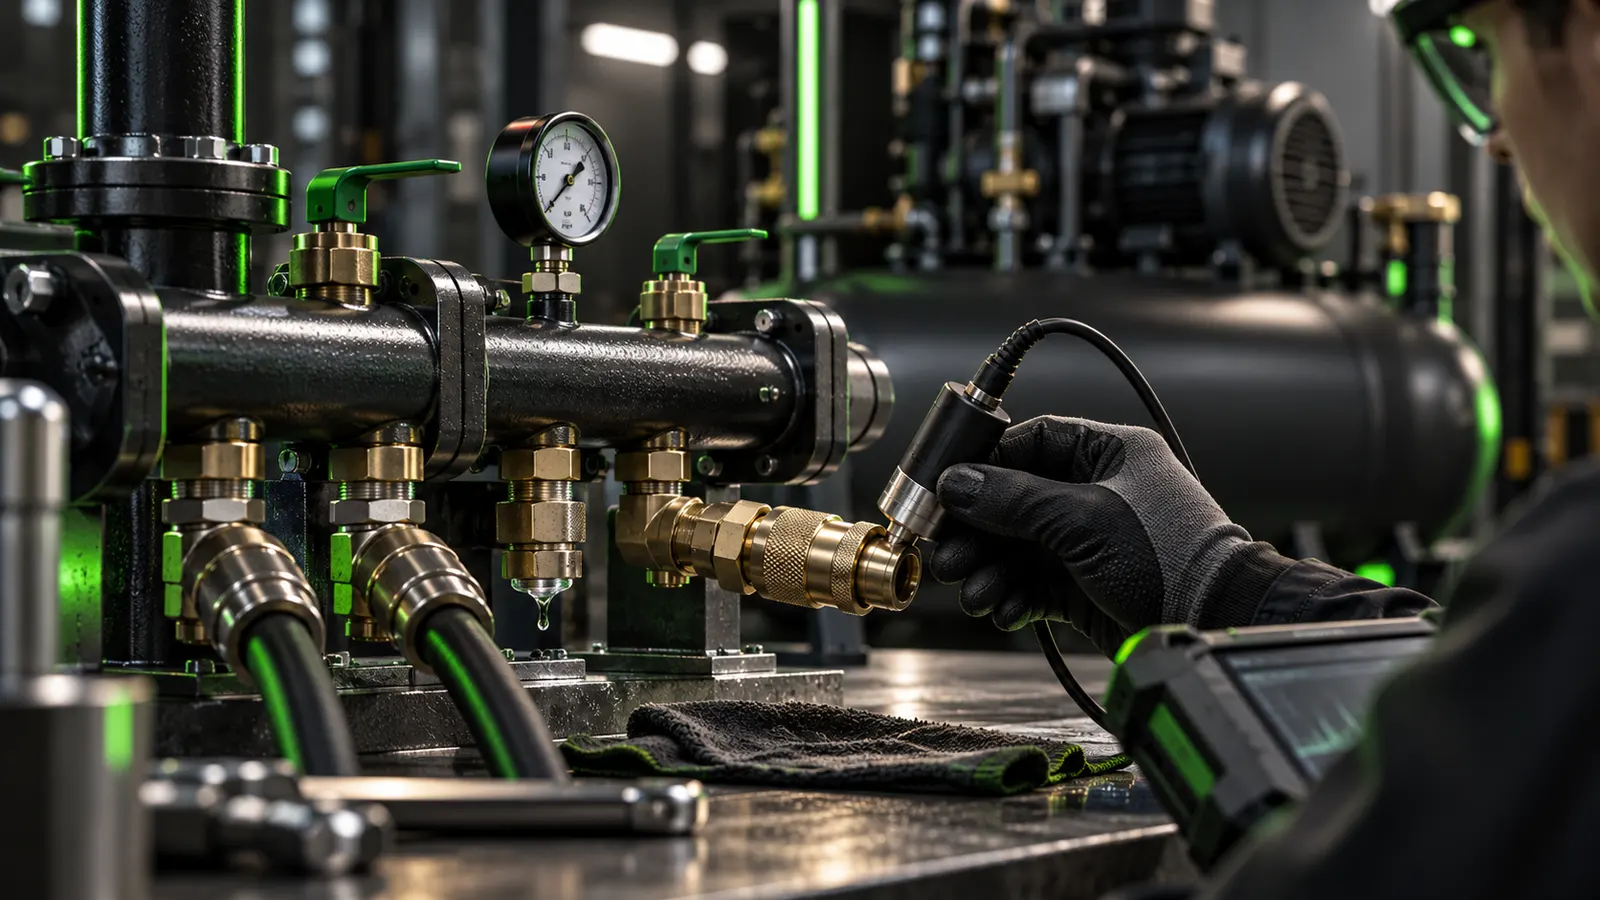
Verify compressed-air leak savings by comparing compressor electricity over comparable operating conditions before and after repair. Record production, system pressure, compressor controls and the measurement boundary beside the kWh result. Reduced airflow does not translate directly into the same percentage of electrical savings, especially when control behavior changes. This fictional matched-shift example calculates measured energy and a conditional cost difference without treating a leak estimate or lower energy-per-unit ratio as causal proof.
Calculate a before-and-after electrical difference with clear units.
Check pressure, control behavior and comparable production.
Keep a conditional annual estimate separate from verified savings.
Set the electrical and production boundary
The US Department of Energy’s compressed-air sourcebook treats leak reduction, compressor controls and system measurement together. The energy consequence depends on how the compressor responds to reduced demand, not only how much air escapes.
Decide which compressors and auxiliaries the meter includes. Record actual kWh where possible, or calculate energy from a defensible interval-average power trace. A nameplate rating multiplied by shift hours is not a measured baseline. Keep useful pressure at the point of use visible.
Compare two explicitly matched fictional shifts
In our illustrative record, both shifts last 8 hours and produce 3600 accepted units of the same mix under the same required 6.5 bar pressure condition. The baseline average electrical power is 50 kW and the later average is 45 kW at the same boundary.
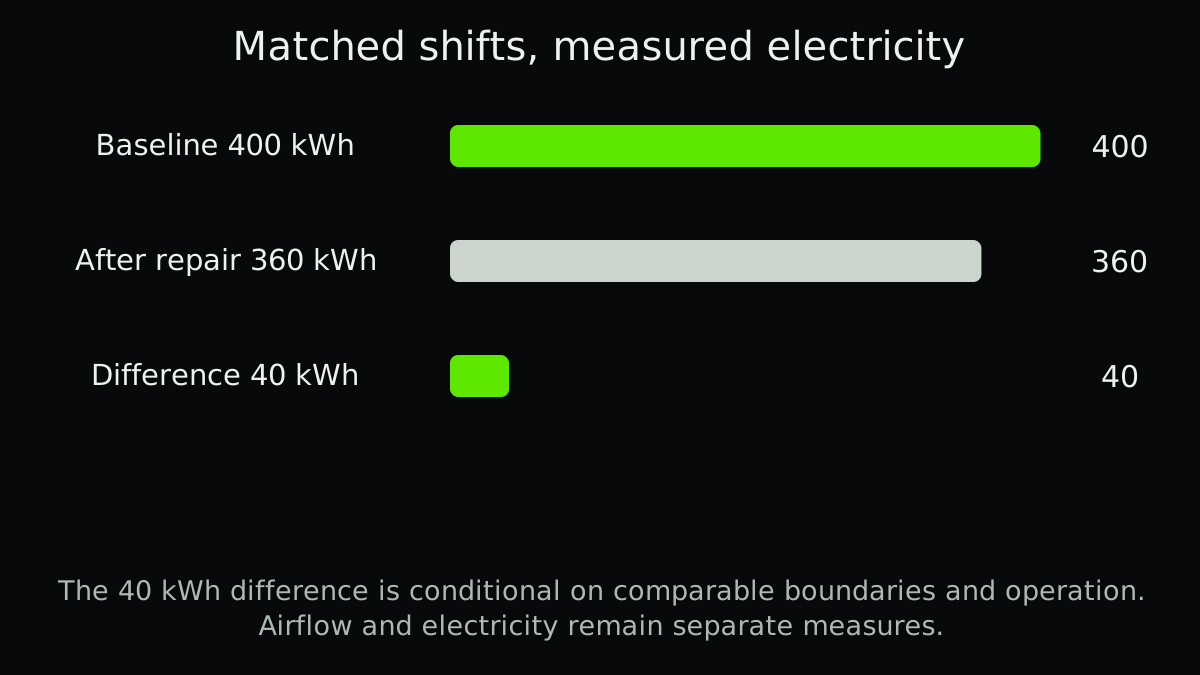
Baseline energy is 400 kWh; the later shift uses 360 kWh. The observed difference is 40 kWh, or 10% of baseline energy. At an assumed flat EUR 0.15/kWh, the energy-charge difference is EUR 6 per matched shift. Real tariffs and demand charges need their own treatment.
40 kWh × EUR 0.15/kWh = EUR 6 per matched shift. Numbers are fictional; other production, weather and control changes must be investigated.
| Comparable input | Baseline shift | After-repair shift |
|---|---|---|
| Duration | 8 h | 8 h |
| Accepted output | 3600 units | 3600 units |
| Required operating pressure | 6.5 bar | 6.5 bar |
| Average metered power | 50 kW | 45 kW |
| Energy | 400 kWh | 360 kWh |
| Energy per 1000 accepted units | 111.11 kWh | 100 kWh |
Read the control response before claiming the result
A compressor may unload while still drawing substantial power, continue running because of a minimum-flow constraint or respond through variable speed. Check the actual control state, number of running compressors and pressure settings. Repairing leaks can require control review to realize the expected electrical benefit.
Do not operate or alter a pressurized system from this guide. Leak detection, isolation and repair require trained personnel and approved procedures. An ultrasonic survey locates a possible leak; it is not a substitute for a safe repair plan or a boundary-matched electricity measurement.
Keep normal changes out of the claimed repair effect
Check product mix, operating hours, ambient conditions, air users, pressure profile, idle periods and compressor control changes. A lower kWh total during a shorter production run is not an equivalent comparison. A matched pair is useful evidence, but repeated comparable periods and a treatment of other changes make the conclusion stronger.
Use energy per accepted unit as a supporting metric with the same boundary. Baseline 111.11 and later 100 kWh per 1000 units agree with the absolute difference here because output is equal. Changed output or base loads can make the ratio move for other reasons.
- Record the baseline
Capture the power trace, pressure, controls, air demand and production boundary.
- Identify and repair safely
Use a qualified team and retain repair location, date and method.
- Measure comparable operation
Keep load and pressure comparable or document an appropriate adjustment.
- Review persistence
Recheck leaks, controls and electrical performance over representative periods.
Annualize only with a visible operating assumption
If the same 40 kWh difference occurred on 250 comparable shifts, the conditional energy difference would be 10000 kWh and EUR 1500 at the assumed tariff. That multiplication is a scenario. It does not prove the annual operation will match the two teaching shifts.
Separate energy charges from demand charges, maintenance changes, repair cost and production effects. Do not add an alleged production benefit already counted in a downtime-cost estimate without checking for overlap.
Keep a repair register that can be measured again
The record should connect each repair campaign with its meter boundary, baseline, comparison conditions, pressure checks and later result. Missing pressure or control-state data may leave the electrical attribution unresolved even when the leak is clearly repaired.
The download includes the fictional matched shifts and a blank measurement record. Before the repair, agree who will collect the comparison data. Otherwise, a completed leak list may be all that remains when someone asks how much electricity was saved.
Practical checklist
- Define the electrical meter boundary.
- Use measured power or energy.
- Record production and accepted output.
- Retain pressure and control-state evidence.
- Use approved safe leak-repair procedures.
- Check other changes between periods.
- Label annualization assumptions explicitly.
- Recheck persistence and new leakage.
FAQ
FAQ
Sources and further reading
Authoritative references used to research and verify this guide.