

 Abosh
Process discovery means establishing how work actually happens, including its inputs, handoffs, decisions and exceptions. A SIPOC gives a high-level boundary; a detailed process map shows the steps and branches; event-log analysis can reveal recorded paths and timing. Use them together when the question needs it. None can substitute for missing evidence. Confirm the model with people doing the work, retain unrecorded steps and choose the level of detail from the decision you need to make.
Choose the right boundary and level of detail before drawing.
Combine direct observation with system events without losing manual work.
Keep SIPOC, VSM, process maps and classification levels distinct.
Use SIPOC to agree what is inside the process
SIPOC stands for suppliers, inputs, process, outputs and customers. ASQ describes it as a high-level view and adds constraints and measures in SIPOC+CM. It is often useful in Six Sigma framing or before a Kaizen improvement, but neither method owns the need to define a boundary.
It remains useful when a team disagrees about where a process starts, what it must receive or who uses the result. It cannot explain every decision branch or waiting time. Use a more detailed map for those questions.
Build the boundary around one real request
For a fictional manufacturing route-approval process, start with an accepted request and finish with a route the planner can use. Agree the required drawing, quantity and due date, then ask who supplies and receives each item.
There is no universal seven-step business process. The short sequence here is a local discovery procedure, not a claim about how every business operates. Validate it with actual cases and include rejected or returned work.
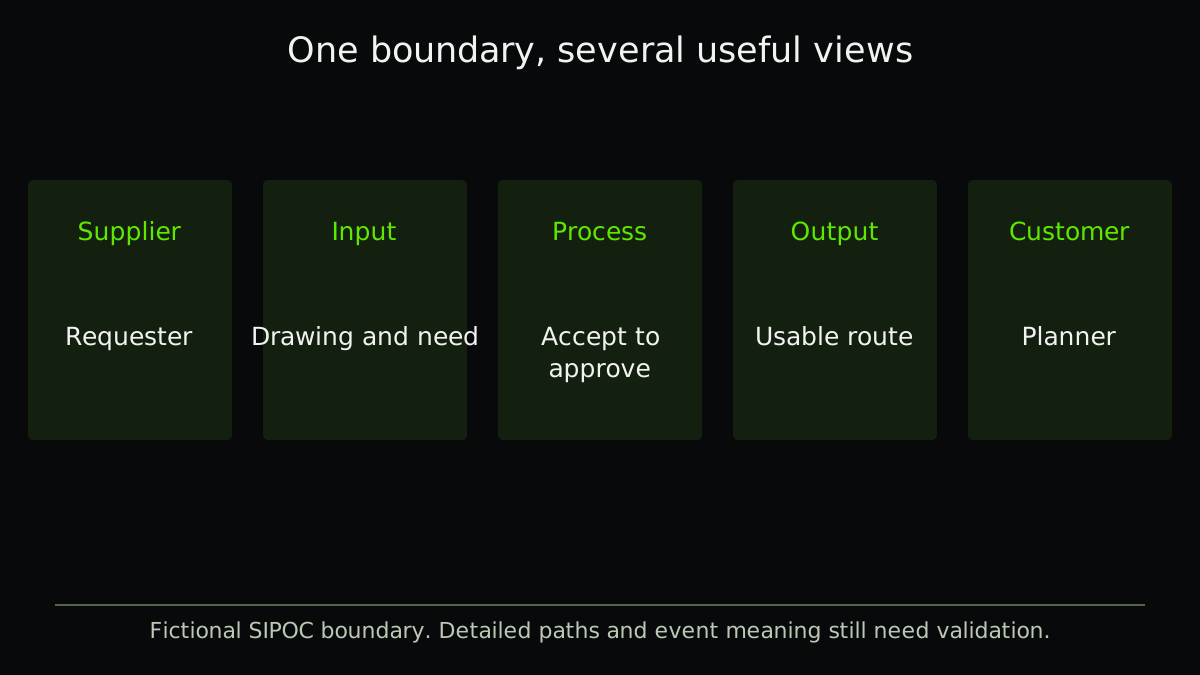
| Supplier | Input | Process boundary | Output | Customer |
|---|---|---|---|---|
| Requester | Current drawing, quantity, due date | Accept request through route approval | Approved usable route | Production planner |
- Agree the customer outcome
Define what makes the output usable and who receives it.
- Set the boundary
Name observable start and finish events.
- List required inputs and suppliers
Check what must be available for work to begin.
- Follow cases and exceptions
Observe actual paths before adding detailed boxes.
- Validate and choose a next question
Resolve disagreements and keep unknowns visible.
Reconcile the event log with what people do
Suppose a fictional request is received at 09:00, corrected at 10:00, approved at 11:00 and released at 11:15. Recorded elapsed time is 135 minutes. A phone call between correction and approval may explain a handoff while leaving no system event.
Process mining can discover recorded paths, check conformance or enhance an existing model, as the IEEE manifesto distinguishes. Logs need a meaningful case identifier, activity and timestamp. An absent event does not prove that no work happened.
Mapping levels need a named convention
APQC organizes its process classification into five levels: category, process group, process, activity and task. Teams can use those levels to organize a process inventory. They still choose the detail and flow of each map; APQC does not require five layers in every diagram.
Organizations also use L1, L2, L3 and L4 for their own overview-to-detail hierarchy. Record what each label means locally. A department list, a process taxonomy and a step-by-step workflow are different views, even when the same names appear in each.
BPM is the management job around the map
Business process management concerns designing, operating, measuring and improving processes. A manufacturing route approval is one example; a supplier quality response or maintenance request is another. That ongoing job remains relevant when a process crosses teams or systems. Buying a BPM product is a separate choice.
Choose a value-stream map for end-to-end material/information flow and its time ladder. Use process mining when suitable logs can answer a path or timing question. A Gemba observation can find work the log misses.
For the next level of flow and waiting detail, use the [value-stream mapping lesson](https://www.youtube.com/watch?v=uXEOuxC1tus).
Stop when extra detail no longer changes the decision
Map the branches that affect the chosen outcome, risk or delay. Avoid copying every screen and click merely because a tool can capture them. Retain source, owner and uncertainty for important steps.
Read the draft with the people doing the work and one person receiving its output. If they cannot agree what complete means, fix that boundary before measuring process performance. The editable record keeps the SIPOC and event assumptions together; it is not a claim that a diagram discovered the true cause.
A related example from Abolfazl
Compare an approval map with the correction loops visible in its event log.
In English, on founder Abolfazl’s personal blog. This is related reading, not an independent technical source.
Practical checklist
- Name the customer and usable output.
- Agree observable start and finish events.
- List required inputs and their suppliers.
- Follow actual cases with the people doing the work.
- Record exceptions and manual handoffs.
- Verify case IDs, activity meaning and timestamps.
- Define local map-level labels explicitly.
- Choose the next decision before adding more detail.
FAQ
FAQ
Sources and further reading
Authoritative references used to research and verify this guide.