

 Abosh
A planner uses conventional material requirements planning, or MRP, to calculate time-phased component needs from a production plan, usable supply and lead times. Demand driven MRP, or DDMRP, adds selected decoupling buffers and replenishment rules based on their net flow position. The planner still needs reliable item data, supply dates and execution checks. Neither method makes an infeasible production or delivery promise feasible by itself.
Keep physical stock separate from the replenishment signal.
Understand a published buffer calculation without treating it as an optimum.
Check which method and software version define the rules.
Compare the planning job before comparing the names
The existing MRP guide starts with 50 display stands requiring two brackets each. After allowing for 20 usable brackets and 30 timely receipts, the planner has 50 brackets left to cover. That calculation depends on the bill of materials, available supply and required dates. Read the MRP/MPS example for the complete boundary.
With DDMRP, the team chooses where stock buffers will decouple parts of the supply route. It sizes and adjusts those buffers, then uses the defined net flow and execution alerts to manage replenishment. The Demand Driven Institute describes this as a planning and execution method; it does not remove the need to configure the model.
The planner must specify both policies before comparing them. A new label, a different stock target or an unchanged ERP screen cannot establish which policy works better for an actual product family.
| Planning question | Conventional MRP | DDMRP |
|---|---|---|
| What starts the calculation? | Time-phased production and component requirements | Defined buffered positions and their replenishment rules |
| Which supply matters? | Usable stock and dated supply against requirements | Stock, eligible open supply and qualified demand in net flow |
| Where do lead times matter? | Dates and offsets through the planned structure | Buffer positioning and the unprotected part of the route |
| What still needs checking? | Materials, capacity, dates and execution | Materials, capacity, dates, buffer assumptions and execution |
Place the buffer before calculating its zones
A planning team chooses decoupling points from the actual product structure and supply conditions. IFS's 25R1 documentation identifies shared components, demand and supply variability, minimum quantities and unprotected lead time among the configuration inputs. A buffer at every item is not an automatic design rule.
The customer-order decoupling point answers where work becomes tied to a particular customer order. A DDMRP stock buffer answers a replenishment-design question. Abosh's make-to-stock/make-to-order note already explains the customer-order boundary. Do not treat the two terms as interchangeable or repeat that whole comparison here.
Check the usable condition of stock too. Parts under a quality hold cannot become available for dispatch merely because a planning screen includes a quantity. Record the eligibility rule and its owner.
Reproduce the published buffer example
IFS publishes an example with average daily usage of 20, unprotected lead time of 14 days, green and red lead-time factors of 50%, a minimum order quantity of 200, an order cycle of seven days and a variability factor of 25%. These are that source's teaching inputs, not measurements from Vrolen or recommended settings for your parts.
Calculate the yellow zone as 20 x 14 = 280. The green-zone candidates are 140 from usage and lead time, 140 from the seven-day order cycle, and 200 from the minimum quantity. IFS selects the largest, 200. The red base is 140 and its safety addition is 35, giving a red zone of 175.
The cumulative levels therefore reach 175 at the top of red, 455 at the top of yellow and 655 at the top of green. Keep a zone's size separate from its cumulative top. Those levels alone do not tell the planner how many units to order today.
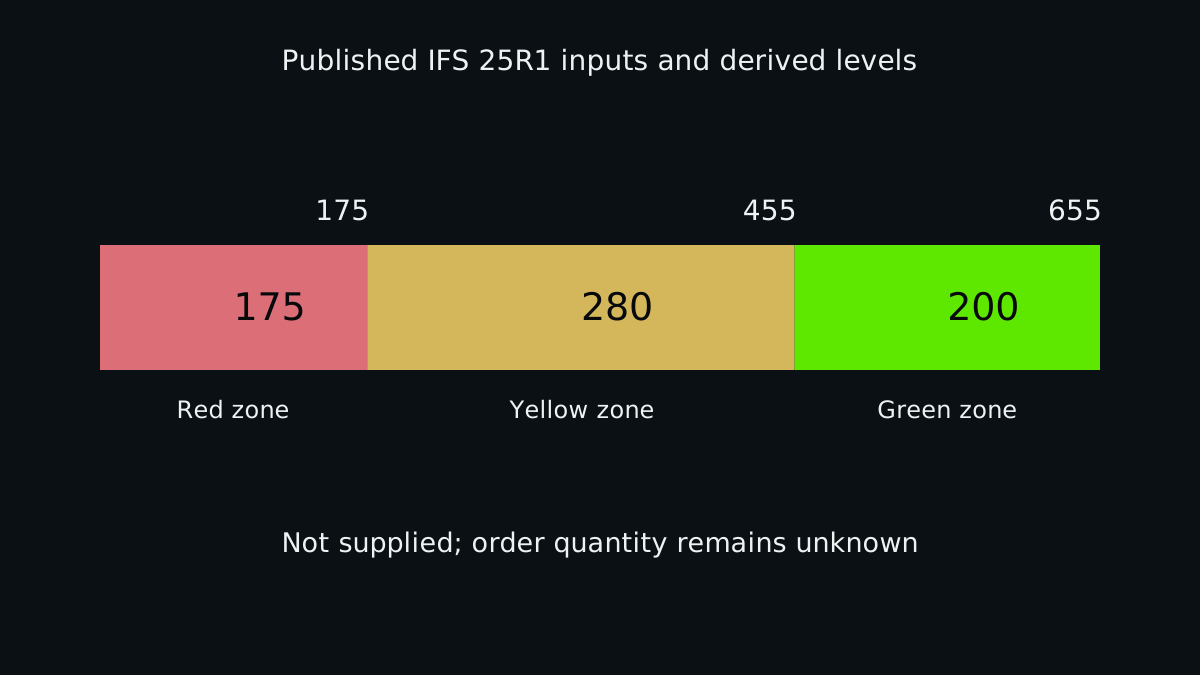
| Published input or derived quantity | Value | Meaning |
|---|---|---|
| Average daily usage | 20 per day | Input in the IFS example |
| Unprotected lead time | 14 days | Input; keep the calendar and usage basis consistent |
| Red zone | 175 | 140 base plus 35 safety addition |
| Yellow zone | 280 | Usage multiplied by unprotected lead time |
| Green zone | 200 | Largest of the three stated candidates |
| Top of yellow / top of green | 455 / 655 | Cumulative levels derived from those zone sizes |
Read net flow and physical stock separately
The planner calculates net flow from on-hand stock plus eligible open supply minus qualified demand. The selected method defines which overdue, current and future demand qualifies. IFS 25R1 distinguishes demands due today, past-due demand and qualifying order spikes; do not subtract every future order without checking those rules.
Physical stock answers what is present now. Open supply still needs its date and status. A replenishment recommendation does not prove that the receipt will arrive on time, pass release checks or fit available capacity. Keep the plan and its execution record connected.
Demand driven does not mean a team must ignore every forecast. IFS documents forecast-based buffer adjustments as one option. Specify whether a forecast changes a buffer setting or enters the qualified-demand calculation; those are different uses of information.
Use the selected method's eligibility, date and spike rules. Missing inputs leave the result unknown.
Name the version behind the component list
The Demand Driven Institute's public overview includes tactical adaptation as a sixth component. The inspected IFS 25R1 and SAP IBP documentation present a five-component grouping. Name the source and software version instead of presenting either count as a timeless universal list.
SAP IBP provides a demand-driven replenishment capability with documented buffer positioning, sizing, adjustments, planning and execution. Check the documentation for the actual product release and configuration you use. This article does not provide SAP setup steps or establish which features your license includes.
Keep the existing safety-stock guide for ordinary coverage and reorder-point questions. A part Kanban and a whole-line CONWIP cap also govern different authorizations. They cannot be compared by simply matching the number of cards to a DDMRP stock level.
Test a fully stated policy on the same operating task
The planner compares service, shortages, usable stock and actual supply performance under a declared product family and period. Retain starting stock, order rules, capacity, holds and disturbances. A model comparison needs a validated baseline; a later improvement does not by itself establish that DDMRP caused it.
- Define the route and product family
Record the supply structure, customer tolerance, usable stock and constrained resources.
- State both policies
Keep MRP inputs and dates separate from DDMRP buffer, qualification and execution rules.
- Check the source records
Reconcile stock, open supply, demand, calendars, units and quality holds.
- Compare the consequences
Inspect delivery, shortages, inventory and exceptions under comparable conditions.
- Keep the settings and result
Record who approved the next change and what evidence will support retaining it.
A stock-position example from Abosh
Compare physical stock with open replenishment and existing commitments before interpreting a planning quantity.
Read the inventory-position note
In English, on founder Abosh's personal blog. This is related teaching material, not independent evidence that DDMRP improves performance.
Practical checklist
- Name the product family and decision boundary.
- Record the governing method and product version.
- Choose and justify the decoupling points.
- Keep zone sizes separate from cumulative tops.
- Define stock and open-supply eligibility.
- State qualified-demand and order-spike rules.
- Keep missing inputs, holds and overdue receipts visible.
- Compare actual service and stock before retaining a setting.
FAQ
FAQ
Sources and further reading
Authoritative references used to research and verify this guide.